- 간트 차트
무료 온라인 간트 차트
온라인에서 간트 차트 만들기
비즈니스 프로세스, 학교 프로젝트 또는 제품 릴리스에서 진행되는 모든 활동을 추적하고 올바른 도구를 사용하여 수행하세요. 간트 차트 메이커를 사용하면 무료 간트 차트 템플릿으로 모든 작업의 타임라인을 매핑하고 진행 상황을 쉽게 모니터링할 수 있습니다. 편리한 도구, 리치 미디어 라이브러리, Canva 화이트보드의 무한 캔버스를 사용하여 팀과 실시간으로 협업하세요.
무한한 아이디어를 위한 무한한 공간
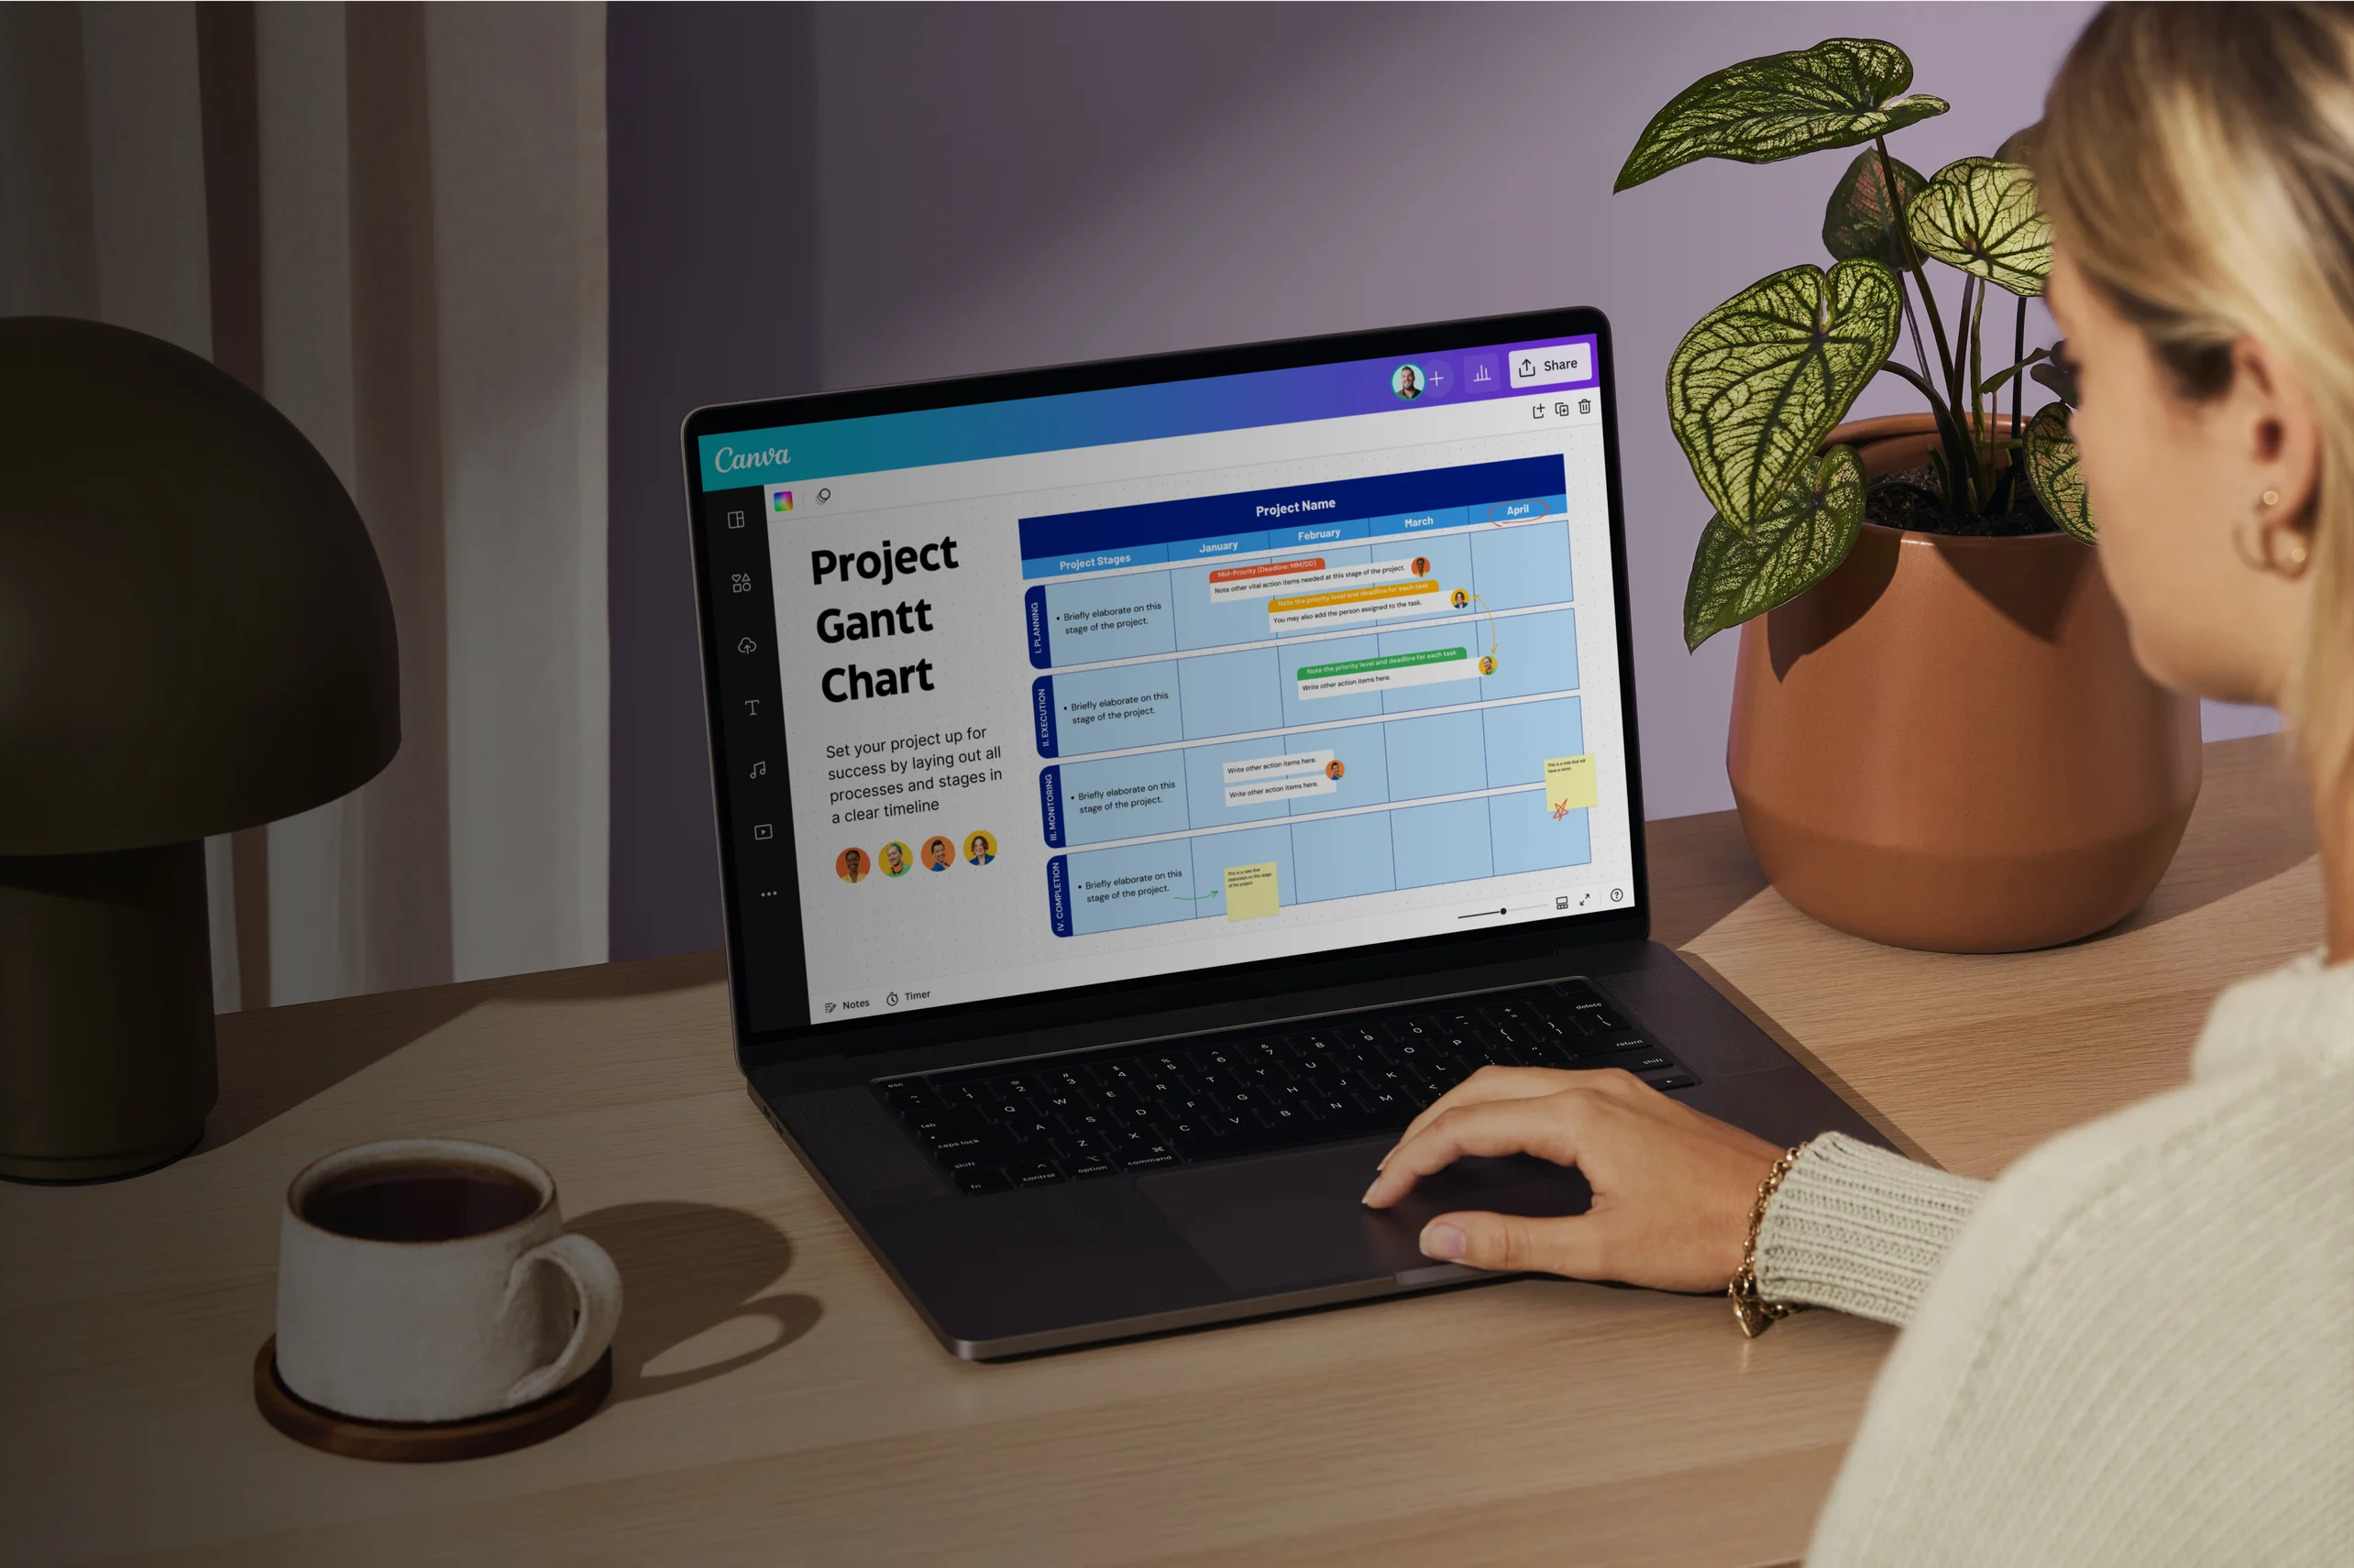
전문가가 디자인한 템플릿으로 워크플로우 가속화
언제 어디서나 모든 디바이스에서 누구와도 아이디어를 공유하고 공유하세요.
화이트보드 요소, 스티커 노트, 타이머로 워크샵을 운영하세요.
문서, 프레젠테이션 등에 간트 차트를 쉽게 삽입하세요.
간편한 온라인 화이트보드 도구 및 데이터 시각화
간트 차트 만드는 방법


간트 차트란 무엇인가요?
간트 차트는 시간 경과에 따른 프로젝트 계획을 시각적으로 보여줍니다. 이 프로젝트 관리 도구는 팀이 대규모 프로젝트를 작업과 하위 작업으로 나누고 타임라인에 배치하여 일정을 잡을 수 있도록 도와줍니다. 각 작업은 차트의 한쪽에 나열되며 각 작업의 반대편에는 작업 길이에 해당하는 가로줄이 있습니다. 이와 같이 작업을 매핑하면 각 작업에 소요되는 시간과 겹치는 작업을 빠르게 확인할 수 있습니다.
간트 차트를 사용하는 이유는 무엇인가요?

간트 차트와 같은 효율적인 프로젝트 관리 도구가 있으면 복잡한 대형 프로젝트가 순조롭게 진행될 수 있습니다. 주어진 프로젝트 타임라인을 시각화할 뿐만 아니라 팀과 이해관계자 간의 이해를 높이고 기대치를 설정할 수 있습니다. 디자인, 마케팅, 이벤트 기획, 제품 및 소프트웨어 개발 등 다양한 산업과 팀에서 사용되는 검증된 도구입니다.
간트 차트를 만들면 팀에서 프로젝트에 대한 전체적인 그림을 그릴 수 있습니다. 프로젝트를 작업과 종속성으로 분류하여 난이도와 우선순위를 평가하고, 적절한 리소스를 할당하고, 일정을 예측하고, 진행 상황과 완료를 추적할 수 있습니다. 이를 통해 궁극적으로 프로젝트 관리자와 이해관계자는 의사 결정을 조정하고, 프로젝트 마일스톤과 마감일을 맞추기 위해 워크로드를 관리하고, 궁극적으로 업무 성과를 높일 수 있는 정보를 얻을 수 있습니다.
간트 차트 구성 요소

작업 목록

타임라인

작업 표시줄

마일스톤

종속성

자료
전체 보기로 프로젝트 관리

See your project sail smoothly with a visual timeline you can navigate. Include every task, process, person, and time in your Gantt chart to forecast resources and efforts at a glance efficiently. Canva allows you to easily create your own professional-looking Gantt chart without learning complicated software. Our easy-to-use Gantt chart maker lets you choose from our template collection. Customize any Gantt chart example using our online whiteboard tools and elements. Fit as many tasks in the infinite canvas to schedule, assign, and execute them better—making project management easier for you and your team.
직장에서의 시각적 프로젝트 계획

Use every visual element in our design library to drive your project to success. Integrate them into components used to create your Gantt chart. You can easily plan your project with visual cues that put business teams and stakeholders on the same page. Organize your task list using tables and bar charts, show dependencies with arrows and shapes, or assign colors to represent team members. Colors and icons can even denote the stage of a project at which a task takes place. Got a specific element in mind? Simply Draw(새 디자인 탭 또는 창에서 열기) it and see it come to life in your Gantt chart.
여러 팀과 동기화하여 작업

Most big projects involve many teams or departments working together. Often, these teams will be in different buildings, cities, or countries. Canva makes team collaboration on our intuitive online whiteboard easy. Create Gantt charts with a colleague or present your project timeline to a stakeholder by quickly sharing a design link. Open your canvas to new ideas to tackle your project. Let your team apply changes to the task list, update progress with comments and virtual sticky notes, and adjust target completions in real time.
모두가 볼 수 있는 간트 차트 만들기

Every stakeholder in your project will love a good Gantt chart. Share your Gantt charts easily with everyone involved in your project. Get everyone on the same page with a timeline they can see. Allow your team to access your design anywhere, from any desktop, iOS, or Android device. Simply email editing or viewing access straight from the editor. Gantt charts go well with your wall, so why not download a high-resolution PNG, JPG, or PDF to print and hang on the wall? Or flash it onscreen like a presentation using the Presenter View? You can embed your Gantt chart on your reports, websites, or Canva Docs.
간트 차트 템플릿에서 디자인 영감을 얻어 보세요.


Assem A
자주 묻는 질문(FAQ)
- 이 차트는 1910~1915년 사이에 프로젝트 관리 도구를 대중화시킨 헨리 간트(Henry Gantt)의 이름을 따서 명명되었습니다. 19세기 후반 폴란드 엔지니어 카롤 아다미에츠키가 만든 하모노그램이라는 초기 차트의 이름을 따서 만든 것입니다.
- 간트 차트는 주로 프로젝트 관리에 사용됩니다. 복잡한 프로젝트가 있는 업계에서는 이 차트를 사용하여 중요한 작업과 일정을 시각적으로 계획하고 추적하여 더 나은 실행과 시간 관리를 할 수 있습니다. 그렇다고 해서 소규모 비즈니스 기업이나 학생 그룹이 사업 개발 계획이나 논문 작업을 위해 간트 차트를 잘 활용하지 못하는 것은 아닙니다. 규모에 관계없이 모든 프로젝트는 잘 짜여진 간트 차트의 이점을 누릴 수 있습니다.
- 올바른 소프트웨어를 사용하면 간트 차트를 사용하는 것이 간단합니다. 간트 차트 메이커에서 사용자 지정 가능한 템플릿을 선택하면 프로젝트를 작업으로 분류하고 프로젝트 시간과 노력을 추정하는 데 도움이 됩니다. 작업을 나열하고 적절하게 순서를 지정한 후 작업 막대를 추가하여 완료 일정을 예측하거나 작업 기간을 표시할 수 있습니다. 이를 통해 팀의 활동과 업무량을 더 쉽게 관리할 수 있습니다.
- 간트 차트를 만들면 시간 관리 도구로도 활용할 수 있습니다. 모든 작업이 나열되면 각 작업의 완료 시간을 예상할 수 있습니다. 종속성이 있는 작업을 기록해 두면 작업 시간을 더 잘 최적화할 수 있습니다. 팀의 역량, 워크로드 및 리소스도 작업을 완료하는 데 걸리는 시간에 영향을 줍니다. 간트 차트가 완성되면 마일스톤과 주의해야 할 마감일이 표시된 보다 정확한 타임라인을 볼 수 있습니다. 여기에서 작업 우선순위를 쉽게 조정하고 결정할 수 있습니다.
- 간트 차트는 사용된 구성 요소를 이해하면 쉽게 읽을 수 있습니다. 차트를 왼쪽에서 오른쪽으로 읽는 것이 가장 이상적입니다. 왼쪽에는 실행 순서대로 정렬된 작업 목록이 표시되고, 오른쪽에는 해당 날짜와 타임라인이 표시됩니다. 색상으로 구분된 각 작업의 가로 막대와 그 길이가 작업 기간을 나타내는지 잘 살펴보세요.