- Gantt Chart
แกนชาร์ตออนไลน์ฟรี
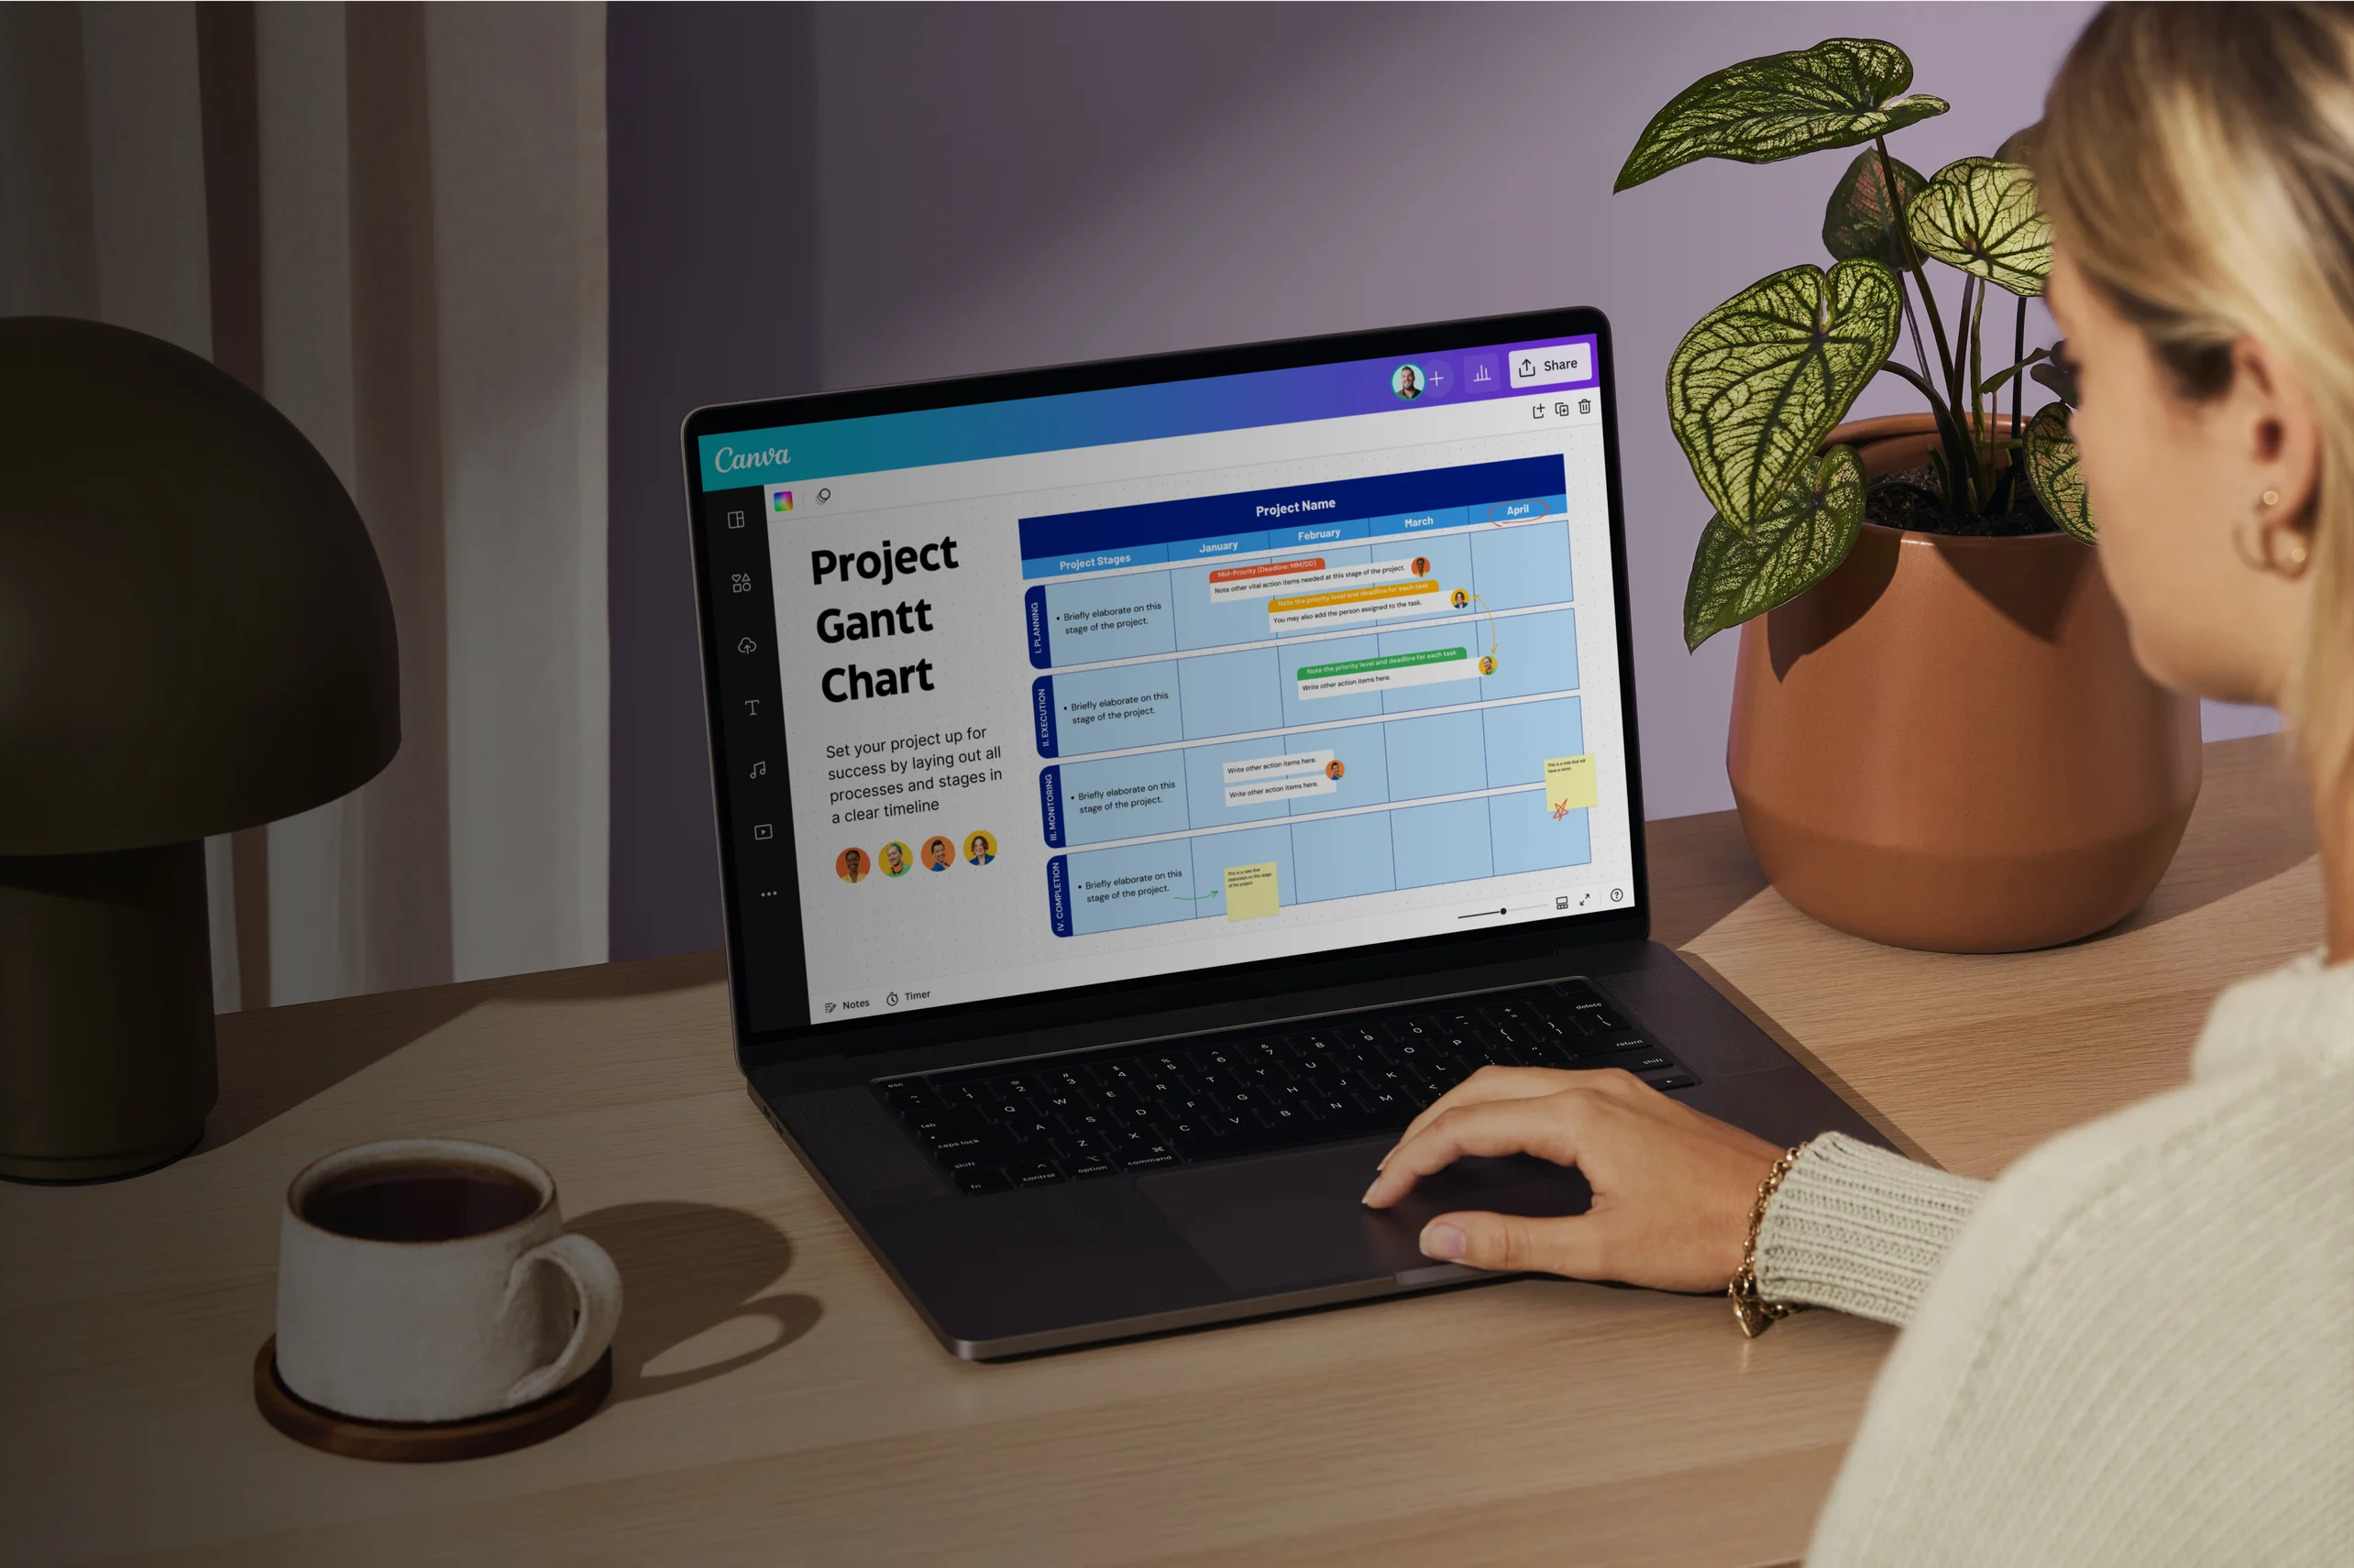
สร้างแกนชาร์ตออนไลน์
ติดตามทุกกิจกรรมที่ดำเนินไปในกระบวนการทางธุรกิจ โปรเจ็คต์ของโรงเรียน หรือการเปิดตัวผลิตภัณฑ์ และดำเนินการด้วยเครื่องมือที่เหมาะสม เครื่องมือสร้างชาร์ต Gantt ของเราช่วยให้คุณสร้างแผนผังไทม์ไลน์สำหรับงานทั้งหมดและติดตามความคืบหน้าได้อย่างง่ายดายด้วยเท็มเพลตชาร์ต Gantt ฟรี ทำงานร่วมกับทีมของคุณแบบเรียลไทม์โดยใช้เครื่องมือที่มีประโยชน์ ไลบรารี่สื่อที่ครบครัน และผืนผ้าใบที่ไม่มีที่สิ้นสุดจาก Canva Whiteboards
พื้นที่อันไร้ขอบเขตสร้างมาเพื่อแนวคิดอันไร้ขีดจำกัด
เท็มเพลตที่ดีไซน์มาอย่างมืออาชีพเพื่อให้ขั้นตอนการทำงานของคุณเสร็จอย่างรวดเร็ว
แชร์และระดมความคิดกับทุกคน ทุกเมื่อ บนทุกอุปกรณ์
จัดเวิร์คช็อปด้วยองค์ประกอบไวท์บอร์ด สติ๊กเกอร์โน้ต และตั้งเวลา
ฝังแกนชาร์ตของคุณใน Docs พรีเซนเทชั่น และอื่นๆ ได้อย่างง่ายดายขึ้น
เครื่องมือไวท์บอร์ดออนไลน์และการแสดงผลข้อมูลด้วยภาพที่ใช้ได้ง่ายดาย
วิธีสร้างแกนชาร์ต


แกนชาร์ตคืออะไร?
แกนชาร์ตจะพรีเซนต์แพลนโปรเจ็คต์ตามเวลาด้วยภาพ เครื่องมือการจัดการโปรเจ็คต์นี้ช่วยให้ทีมกำหนดเวลาโปรเจ็คต์ขนาดใหญ่ได้โดยแบ่งงานออกเป็นชิ้นๆ และงานย่อย แล้วจัดวางงานตามไทม์ไลน์ แต่ละงานจะลิสต์อยู่บนด้านหนึ่งของชาร์ตและมีเส้นในแนวนอนอยู่ตรงข้ามเพื่อบอกระยะเวลาที่ใช้ในการทำงานนั้น เมื่อร่างแผนผังงานออกมาในลักษณะนี้ คุณจะสามารถดูได้อย่างรวดเร็วว่าแต่ละงานจะใช้เวลานานเท่าใดและงานใดทับซ้อนกันบ้าง
ทำไมถึงต้องใช้แกนชาร์ต

การมีเครื่องมือการจัดการโปรเจ็คต์ที่มีประสิทธิภาพอย่างแกนชาร์ตจะช่วยให้โปรเจ็คต์ขนาดใหญ่ที่ซับซ้อนดำเนินไปอย่างราบรื่น นอกจากจะสร้างภาพไทม์ไลน์ของโปรเจ็คต์ที่กำหนดแล้ว เครื่องมือนี้ยังสร้างความเข้าใจและกำหนดความคาดหวังระหว่างทีมและผู้มีส่วนได้ส่วนเสียอีกด้วย โดยเป็นเครื่องมือสำหรับการลองผิดลองถูกซึ่งใช้ในอุตสาหกรรมและทีมต่างๆ ในด้านการดีไซน์ การตลาด การวางแผนอีเวนต์ การพัฒนาผลิตภัณฑ์และซอฟต์แวร์ และอื่นๆ
การสร้างแกนชาร์ตทำให้ทีมของคุณเห็นภาพที่สมบูรณ์ของโปรเจ็คต์ คุณสามารถแบ่งโปรเจ็คต์ของคุณออกเป็นชิ้นงานต่างๆ และความสัมพันธ์เชิงอ้างอิงเพื่อประเมินความยากและลำดับความสำคัญ มอบหมายทรัพยากรที่เหมาะสม คาดการณ์กำหนดเวลา และติดตามความคืบหน้าและความสำเร็จได้ ซึ่งในท้ายที่สุดนี้จะช่วยให้ผู้จัดการโปรเจ็คต์และผู้มีส่วนได้ส่วนเสียได้รับข้อมูลในการปรับเทียบการตัดสินใจ จัดการภาระงานเพื่อให้บรรลุเป้าหมายสำคัญและกำหนดเวลาของโปรเจ็คต์ ซึ่งสุดท้ายแล้วจะนำไปสู่ความเลิศในการทำงาน
ส่วนประกอบของแกนชาร์ต

ลิสต์งาน

ไทม์ไลน์

แถบงาน

เป้าหมาย

ความสัมพันธ์เชิงอ้างอิง

ทรัพยากร
การจัดการโปรเจ็คต์ในมุมมองแบบเต็ม

See your project sail smoothly with a visual timeline you can navigate. Include every task, process, person, and time in your Gantt chart to forecast resources and efforts at a glance efficiently. Canva allows you to easily create your own professional-looking Gantt chart without learning complicated software. Our easy-to-use Gantt chart maker lets you choose from our template collection. Customize any Gantt chart example using our online whiteboard tools and elements. Fit as many tasks in the infinite canvas to schedule, assign, and execute them better—making project management easier for you and your team.
การวางแผนโปรเจ็คต์ที่แสดงเป็นภาพในที่ทำงาน

Use every visual element in our design library to drive your project to success. Integrate them into components used to create your Gantt chart. You can easily plan your project with visual cues that put business teams and stakeholders on the same page. Organize your task list using tables and bar charts, show dependencies with arrows and shapes, or assign colors to represent team members. Colors and icons can even denote the stage of a project at which a task takes place. Got a specific element in mind? Simply Draw(เปิดในแท็บหรือหน้าต่างใหม่) it and see it come to life in your Gantt chart.
ทำงานร่วมกับหลายทีมพร้อมกัน

Most big projects involve many teams or departments working together. Often, these teams will be in different buildings, cities, or countries. Canva makes team collaboration on our intuitive online whiteboard easy. Create Gantt charts with a colleague or present your project timeline to a stakeholder by quickly sharing a design link. Open your canvas to new ideas to tackle your project. Let your team apply changes to the task list, update progress with comments and virtual sticky notes, and adjust target completions in real time.
สร้างชาร์ต Gantt เพื่อให้ทุกคนเห็น

Every stakeholder in your project will love a good Gantt chart. Share your Gantt charts easily with everyone involved in your project. Get everyone on the same page with a timeline they can see. Allow your team to access your design anywhere, from any desktop, iOS, or Android device. Simply email editing or viewing access straight from the editor. Gantt charts go well with your wall, so why not download a high-resolution PNG, JPG, or PDF to print and hang on the wall? Or flash it onscreen like a presentation using the Presenter View? You can embed your Gantt chart on your reports, websites, or Canva Docs.
เริ่มต้นด้วยแรงบันดาลใจดีๆ เพียงใช้เท็มเพลตแกนชาร์ต


แอสเซม เอ
คำถามที่พบบ่อย
- ชาร์ตนี้ได้รับการตั้งชื่อตามผู้สร้าง ซึ่งก็คือ Henry Gantt ซึ่งเป็นผู้ทำให้เครื่องมือการจัดการโปรเจ็คต์ของเขาเป็นที่นิยมในช่วงปี 1910-1915 โดยลักษณะของชาร์ตจะคล้ายกับชาร์ตก่อนหน้านี้ซึ่งมีอยู่ในช่วงปลายศตวรรษที่ 19 และสร้างโดยวิศวกรชาวโปแลนด์ชื่อ Karol Adamiecki เรียกว่าฮาร์โมโนแกรม
- หลักๆ แล้วแกนชาร์ตจะใช้สำหรับการจัดการโปรเจ็คต์ อุตสาหกรรมที่มีโปรเจ็คต์ที่ซับซ้อนจะใช้ชาร์ตชนิดนี้เพื่อวางแผนและติดตามงานและกำหนดเวลาที่สำคัญด้วยภาพ เพื่อการดำเนินการและการจัดการเวลาที่ดีขึ้น แต่ก็ไม่ได้หมายความว่าองค์กรธุรกิจขนาดเล็กหรือกลุ่มนักศึกษาจะไม่สามารถใช้ชาร์ต Gantt ดีๆ สำหรับแพลนพัฒนาธุรกิจหรืองานวิทยานิพนธ์ของตัวเองได้ โปรเจ็คต์ใดๆ ไม่ว่าจะมีขนาดเท่าใด ก็สามารถได้รับประโยชน์จากชาร์ต Gantt ที่ผ่านการคิดมาเป็นอย่างดีได้
- สามารถใช้แกนชาร์ตได้ง่ายๆ ด้วยซอฟต์แวร์ที่เหมาะสม เลือกเท็มเพลตที่ปรับแต่งได้จากเครื่องมือสร้างชาร์ต Gantt เพื่อช่วยแบ่งโปรเจ็คต์ออกเป็นงานต่างๆ และประเมินเวลาและความพยายามที่ต้องใช้ในการทำโปรเจ็คต์ของคุณ หลังจากลิสต์งานออกมาและจัดลำดับอย่างถูกต้องแล้ว คุณสามารถเพิ่มแถบงานเพื่อคาดการณ์กำหนดเวลาที่จะเสร็จสิ้นหรือระบุระยะเวลาของงานได้ จากนั้น การจัดการกิจกรรมและภาระงานของทีมคุณจะง่ายขึ้น
- การสร้างแกนชาร์ตยังทำหน้าที่เป็นเครื่องมือในการบริหารเวลาได้อีกด้วย เมื่องานทั้งหมดของคุณแสดงเป็นลิสต์ลงมา คุณจะสามารถประเมินได้ว่างานใดควรจะเสร็จเมื่อใด ให้ความใส่ใจกับงานที่มีความสัมพันธ์เชิงพึ่งพาเพื่อจัดการระยะเวลาให้เหมาะสมมากขึ้น ความสามารถ ภาระงาน และทรัพยากรของทีมของคุณก็ส่งผลต่อระยะเวลาที่ต้องใช้ในการทำงานให้สำเร็จเช่นเดียวกัน เมื่อชาร์ต Gantt ของคุณเสร็จสมบูรณ์ คุณจะเห็นไทม์ไลน์ที่แม่นยำยิ่งขึ้นพร้อมเป้าหมายสำคัญและเดดไลน์ที่เลื่อนไม่ได้ที่ต้องระวังไว้ คุณสามารถปรับเทียบและตัดสินใจเกี่ยวกับลำดับความสำคัญของงานได้อย่างง่ายดายจากตรงนั้น
- แกนชาร์ตนั้นอ่านง่ายเมื่อคุณเข้าใจส่วนประกอบที่ใช้ คุณสามารถอ่านชาร์ตจากซ้ายไปขวาได้ตามต้องการ ลิสต์งานจะปรากฏทางด้านซ้ายโดยจัดเรียงตามลำดับการดำเนินการ ในขณะที่วันที่และไทม์ไลน์ที่เกี่ยวข้องจะปรากฏทางด้านขวา เพียงมองหาแถบแนวนอนของแต่ละงาน ซึ่งมักจะทำเป็นโค้ดสี และความยาวของแถบนั้นจะแสดงระยะเวลา