Adding axis annotations in Flourish
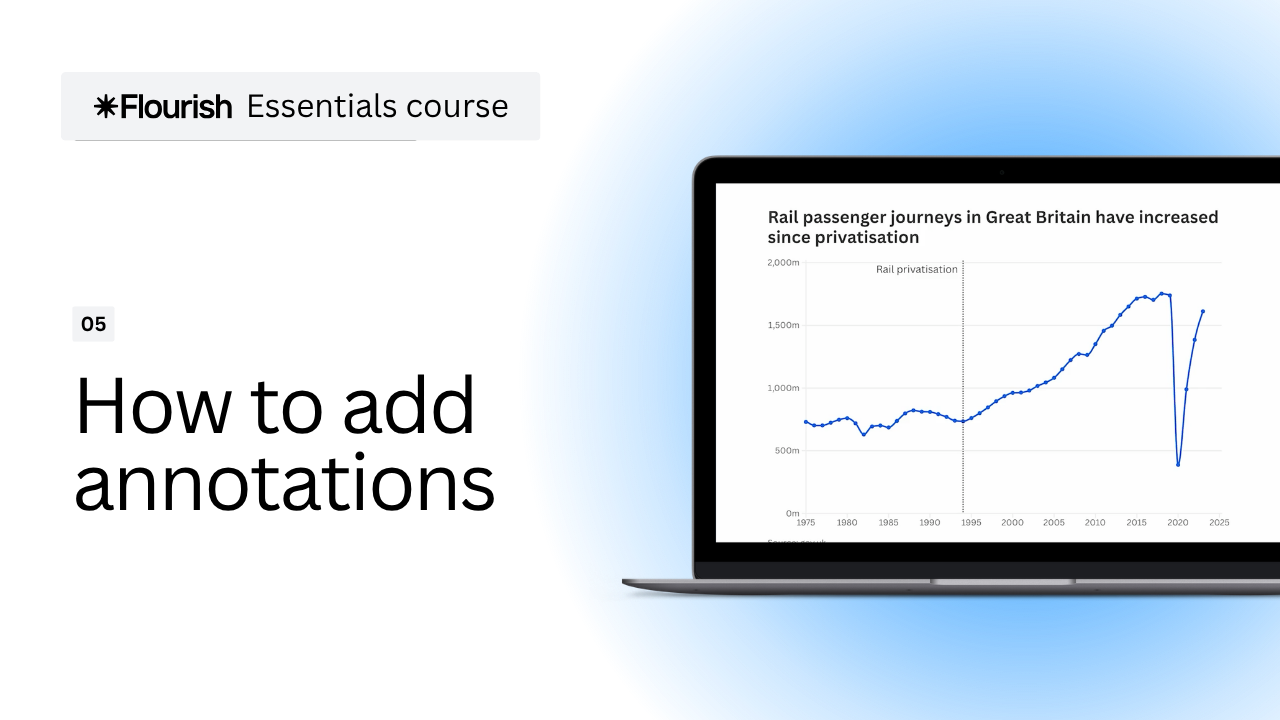
This lesson shows how to layer annotations onto a line chart's axes, from marking a single pivotal moment to highlighting an entire date range.
Adding axis annotations in Flourish
5m
This lesson shows how to layer annotations onto a line chart's axes, from marking a single pivotal moment to highlighting an entire date range.
Adding axis annotations in Flourish
This lesson shows how to layer annotations onto a line chart's axes, from marking a single pivotal moment to highlighting an entire date range.
Adding axis annotations in Flourish
5m
This lesson shows how to layer annotations onto a line chart's axes, from marking a single pivotal moment to highlighting an entire date range.

Lesson outline
What you’ll learn
- Adding a point annotation to flag a specific moment on the x-axis, and adjusting its width and orientation
- Adding a range annotation to highlight a stretch of time, and the difference between input and display date formats
- Styling annotations with custom color and opacity
- Adding a simple, unlabeled reference line to mark a threshold like zero