- Gantt Chart
Creating a Gantt chart: How-tos, templates, and tips
Jump to:
What is a Gantt chart?
A Gantt chart is a type of chart that represents your project and plots tasks across a timeline. It’s one of the most commonly used project management tools.
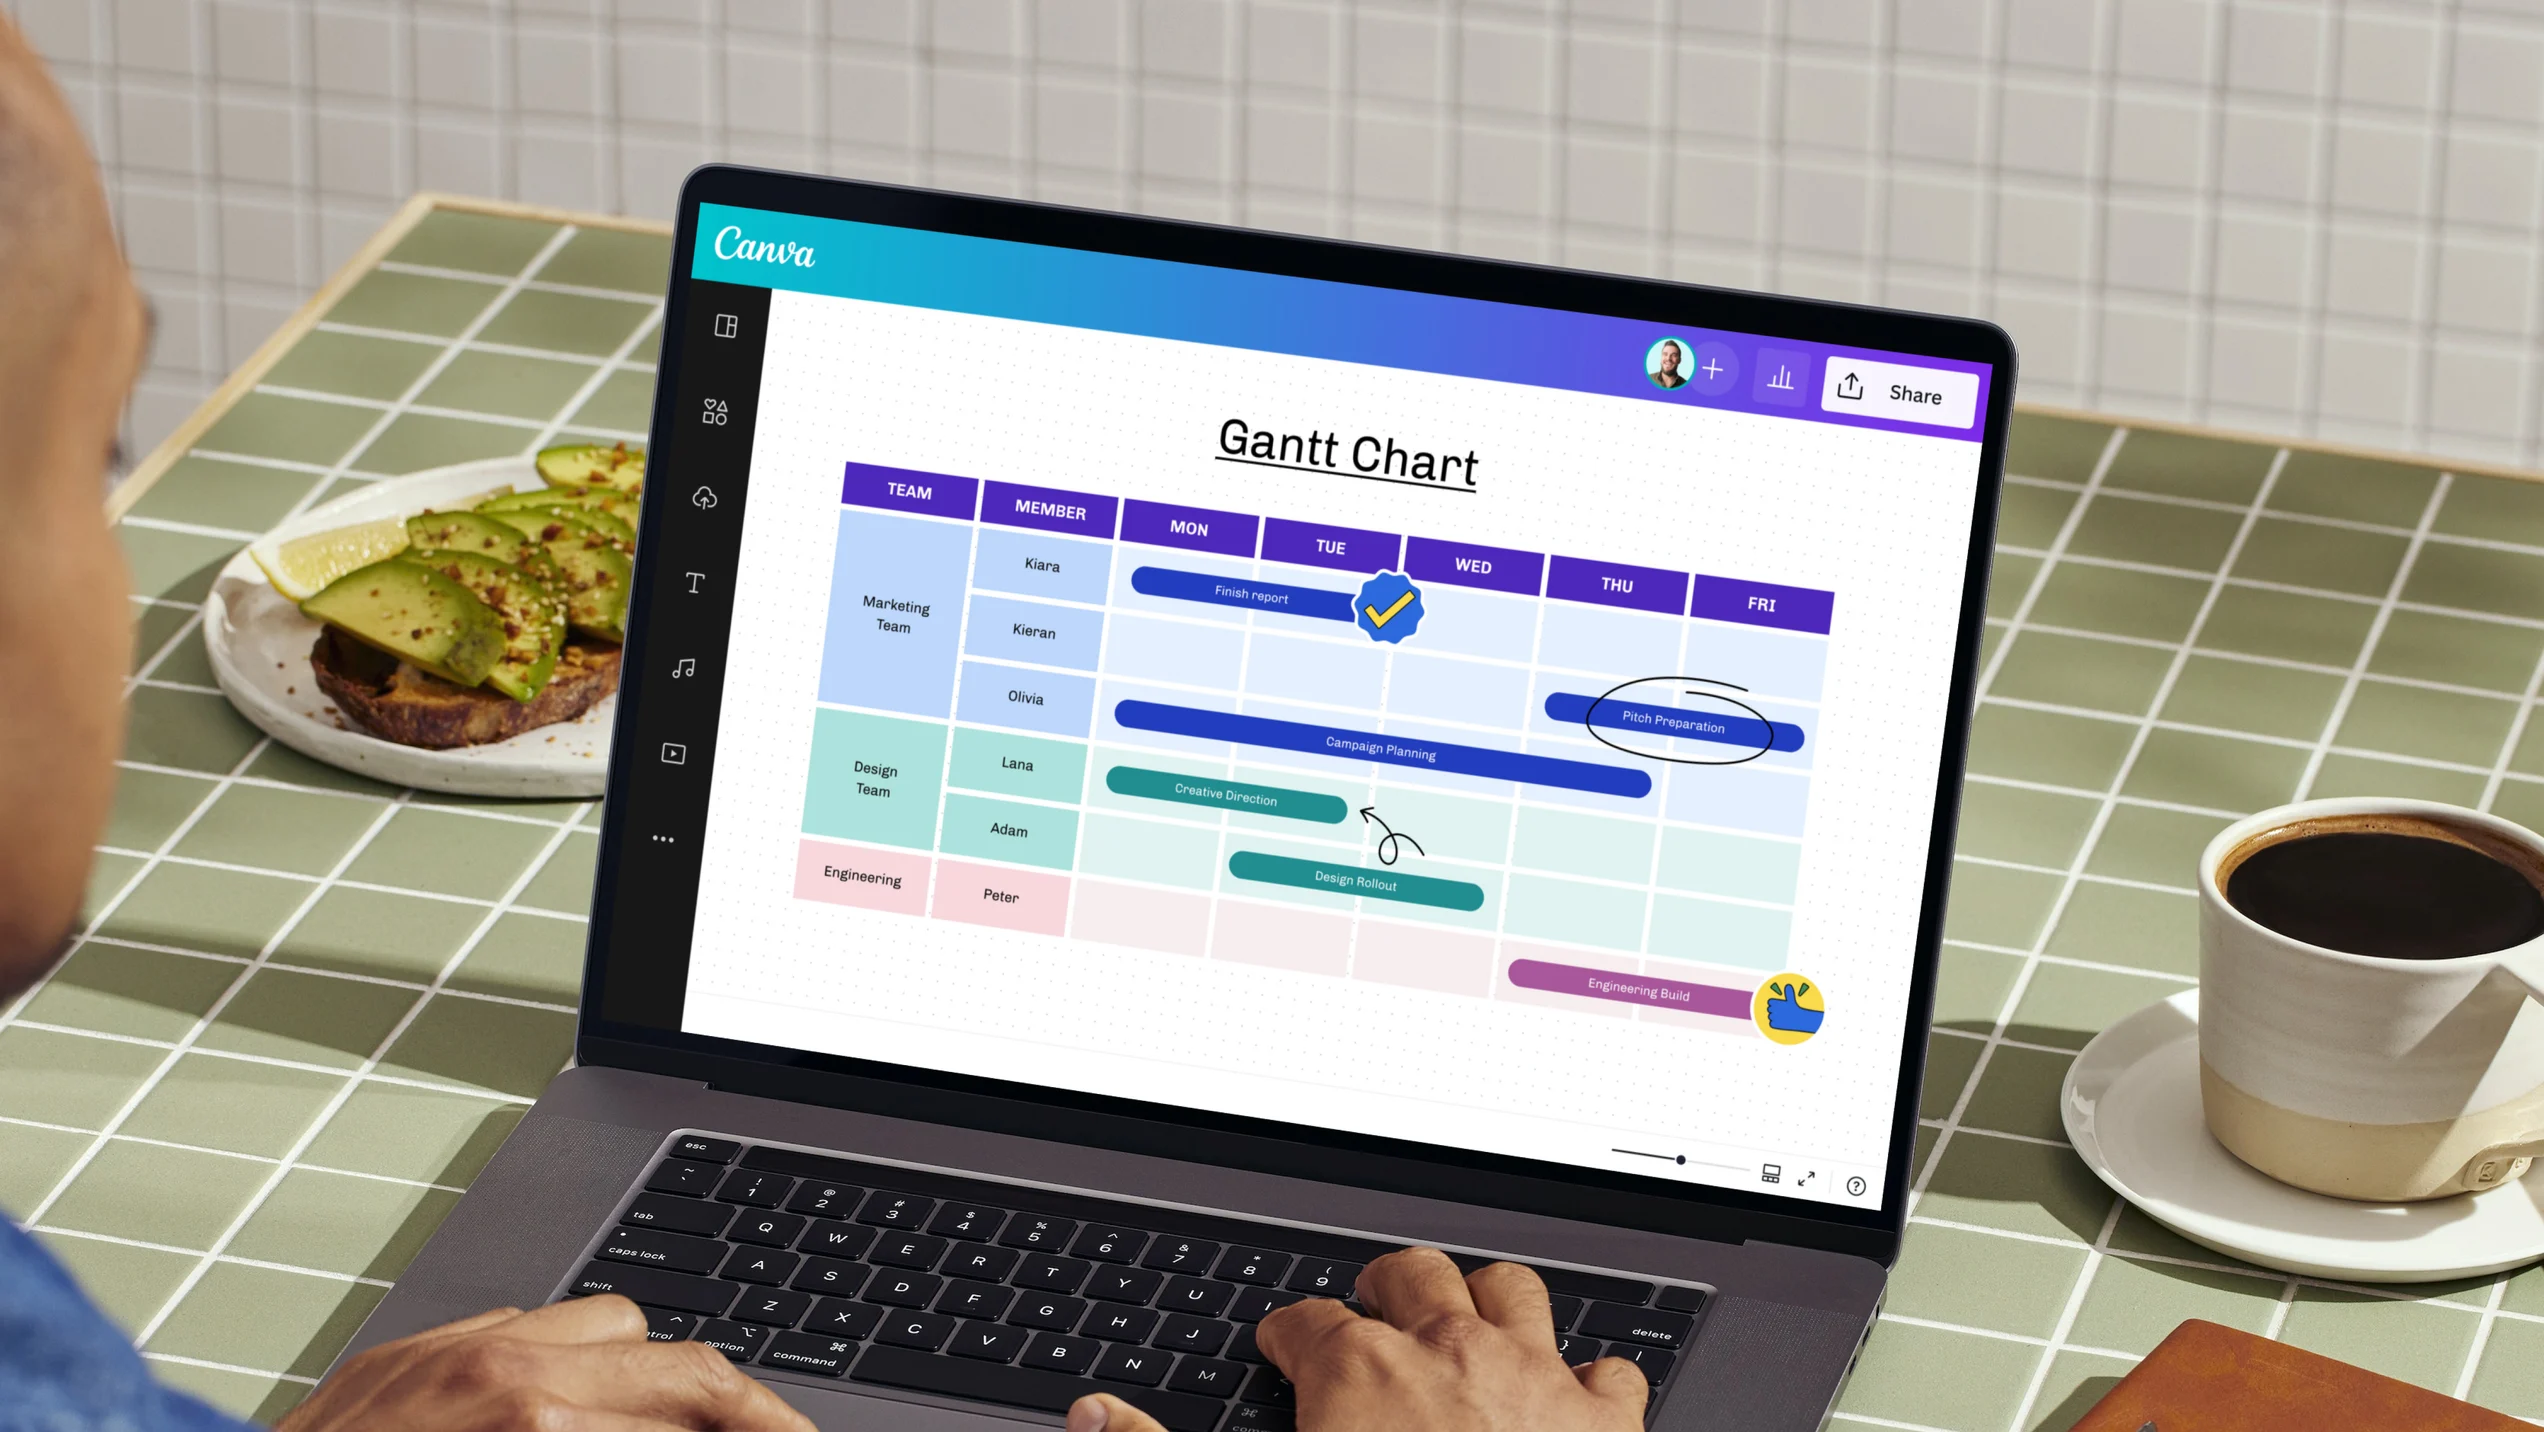
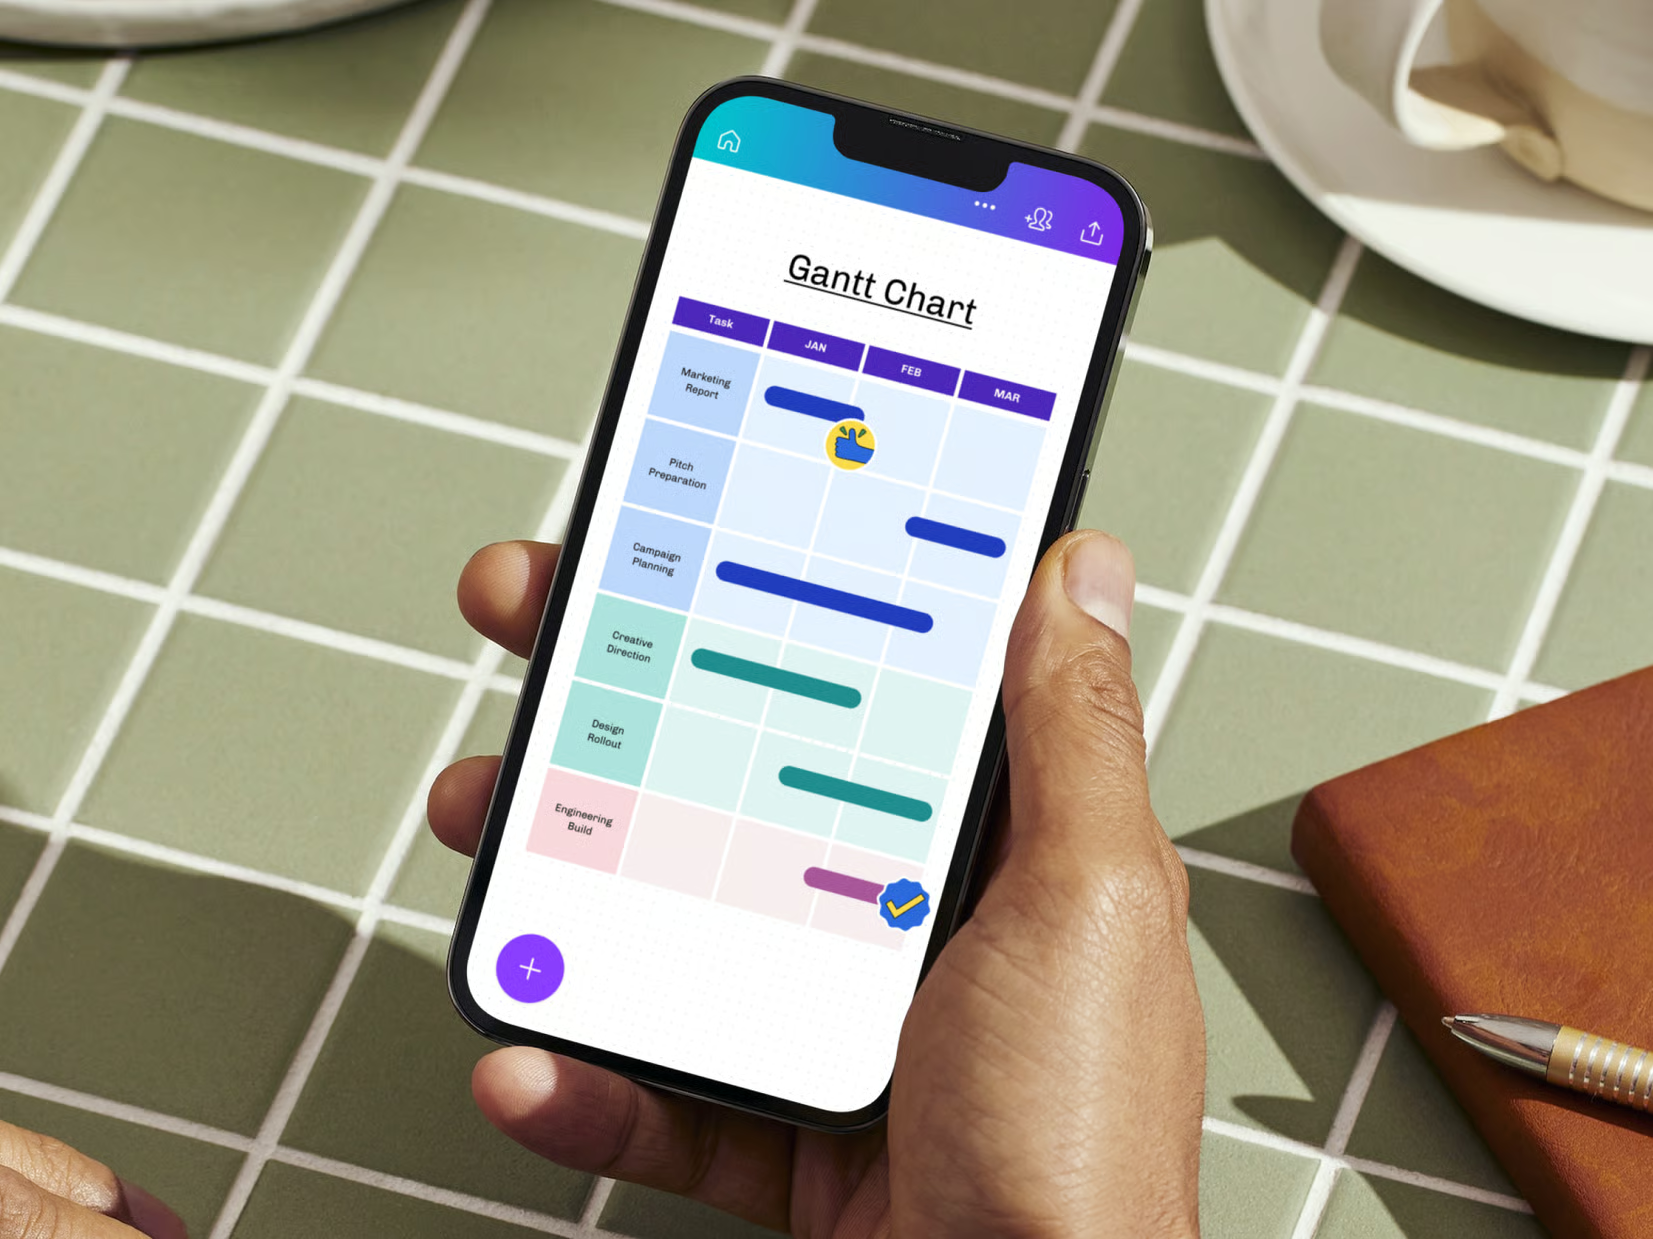
The typical Gantt chart format lists tasks vertically down on the left, while a timeline runs horizontally across the top of the chart. Horizontal bars, or Gantt bars, represent each task's progress, duration, and start and end dates. A Gantt chart also shows milestones, assignees, and dependencies between tasks.

With Gantt charts, teams can quickly glance at the tasks that need to be done, when they're expected to be done, who's responsible for each task, and how some tasks depend on others.
Remember, 86% of global business leaders use data visualization(opens in a new tab or window) when making plans and presentations. So it’s no surprise that Gantt charts are widely used in various industries, from marketing to construction. Gantt charts:
- Simplify communication between teams
- Help spot potential bottlenecks
- Visualize the whole project
History of the Gantt chart
Gantt charts have come a long way since its earliest versions. In 1896, Karol Adamiecki, a Polish engineer, created a chart called the harmonogram, the precursor to the Gantt chart. However, it didn’t become popular outside his native Poland.
Years later, Henry Gantt, an American engineer and management consultant, developed his own version of the chart to evaluate the productivity of factory workers. The two systems—Gantt’s new chart and the harmonogram—have since come together to form the modern Gantt chart.
Original Gantt charts were painstakingly made on paper, with each change or amendment drawn by hand. However, with the rise of digital tools, making a Gantt chart is now quicker and easier using online project management apps.
Components of a Gantt chart
At its simplest, a Gantt chart consists of a list of tasks on the vertical axis, a timeline on the horizontal axis, and bars that represent each task. The other elements (diamonds, arrows, etc.) provide more details. Knowing the basic components will also help you learn how to read a Gantt chart.

Task list
A vertical list of activities involved in the project placed on the left side of the chart

Timeline
A horizontal timeline on top of the chart showing the days, weeks, or months of the project

Bars
Horizontal markers for each task, representing its duration and start and end dates

Arrows
Lines or arrows that show dependencies or tasks that should happen in a certain order

Assignees
Labels that show the people or team responsible for completing each task

Diamonds
Special icons that mark milestones, accomplishments, or important dates

Dateline
A vertical line that indicates the current date on the Gantt chart

Progress
A percentage or bar shading showing the progress of a task

Critical Path
A sequence of dependent tasks critical to meeting the deadline, often the longest task sequence
When to use a Gantt chart
Use a Gantt chart when you need to visualize all tasks and subtasks against the project time frame. A Gantt chart gives you time-centric insight into the progress of each task. It shows you what needs to be done by a certain date in order to proceed with the next task and so on, to eventually deliver the final product or reach the overarching goal.
Use a Gantt chart to create a detailed breakdown of your project.
A Gantt chart is immensely helpful when you:
- Plan the tasks: A Gantt chart shows, at a glance, all the tasks involved and breaks them down into smaller subtasks. The chart also shows the assignees or the people directly responsible for each task.
- Schedule the tasks: A Gantt chart maps out a timeline for the entire project. This includes the total amount of time it will take to finish the entire project, as well as the duration of each subtask. It’s also easier to adjust schedules in case of delays.
- Map out dependencies: When you create a Gantt chart, you can easily plot dependent tasks. This is handy when a sequence of dependent tasks involves different teams.
- Monitor progress: Gantt charts let you keep an eye on the progress of each task. It also marks milestones, so you can celebrate wins along the way.
What types of teams commonly use Gantt charts?
Gantt charts are especially popular in event planning, IT and software development, marketing, and construction. However, anyone handling a project will benefit from using a Gantt chart. This includes teachers, healthcare professionals, telecommunications experts, human resources, and even remote personnel.
So long as there’s a time-bound project, a Gantt chart will be handy.
Use of Gantt charts by industry
Explore six examples of how Gantt charts are used in different fields:

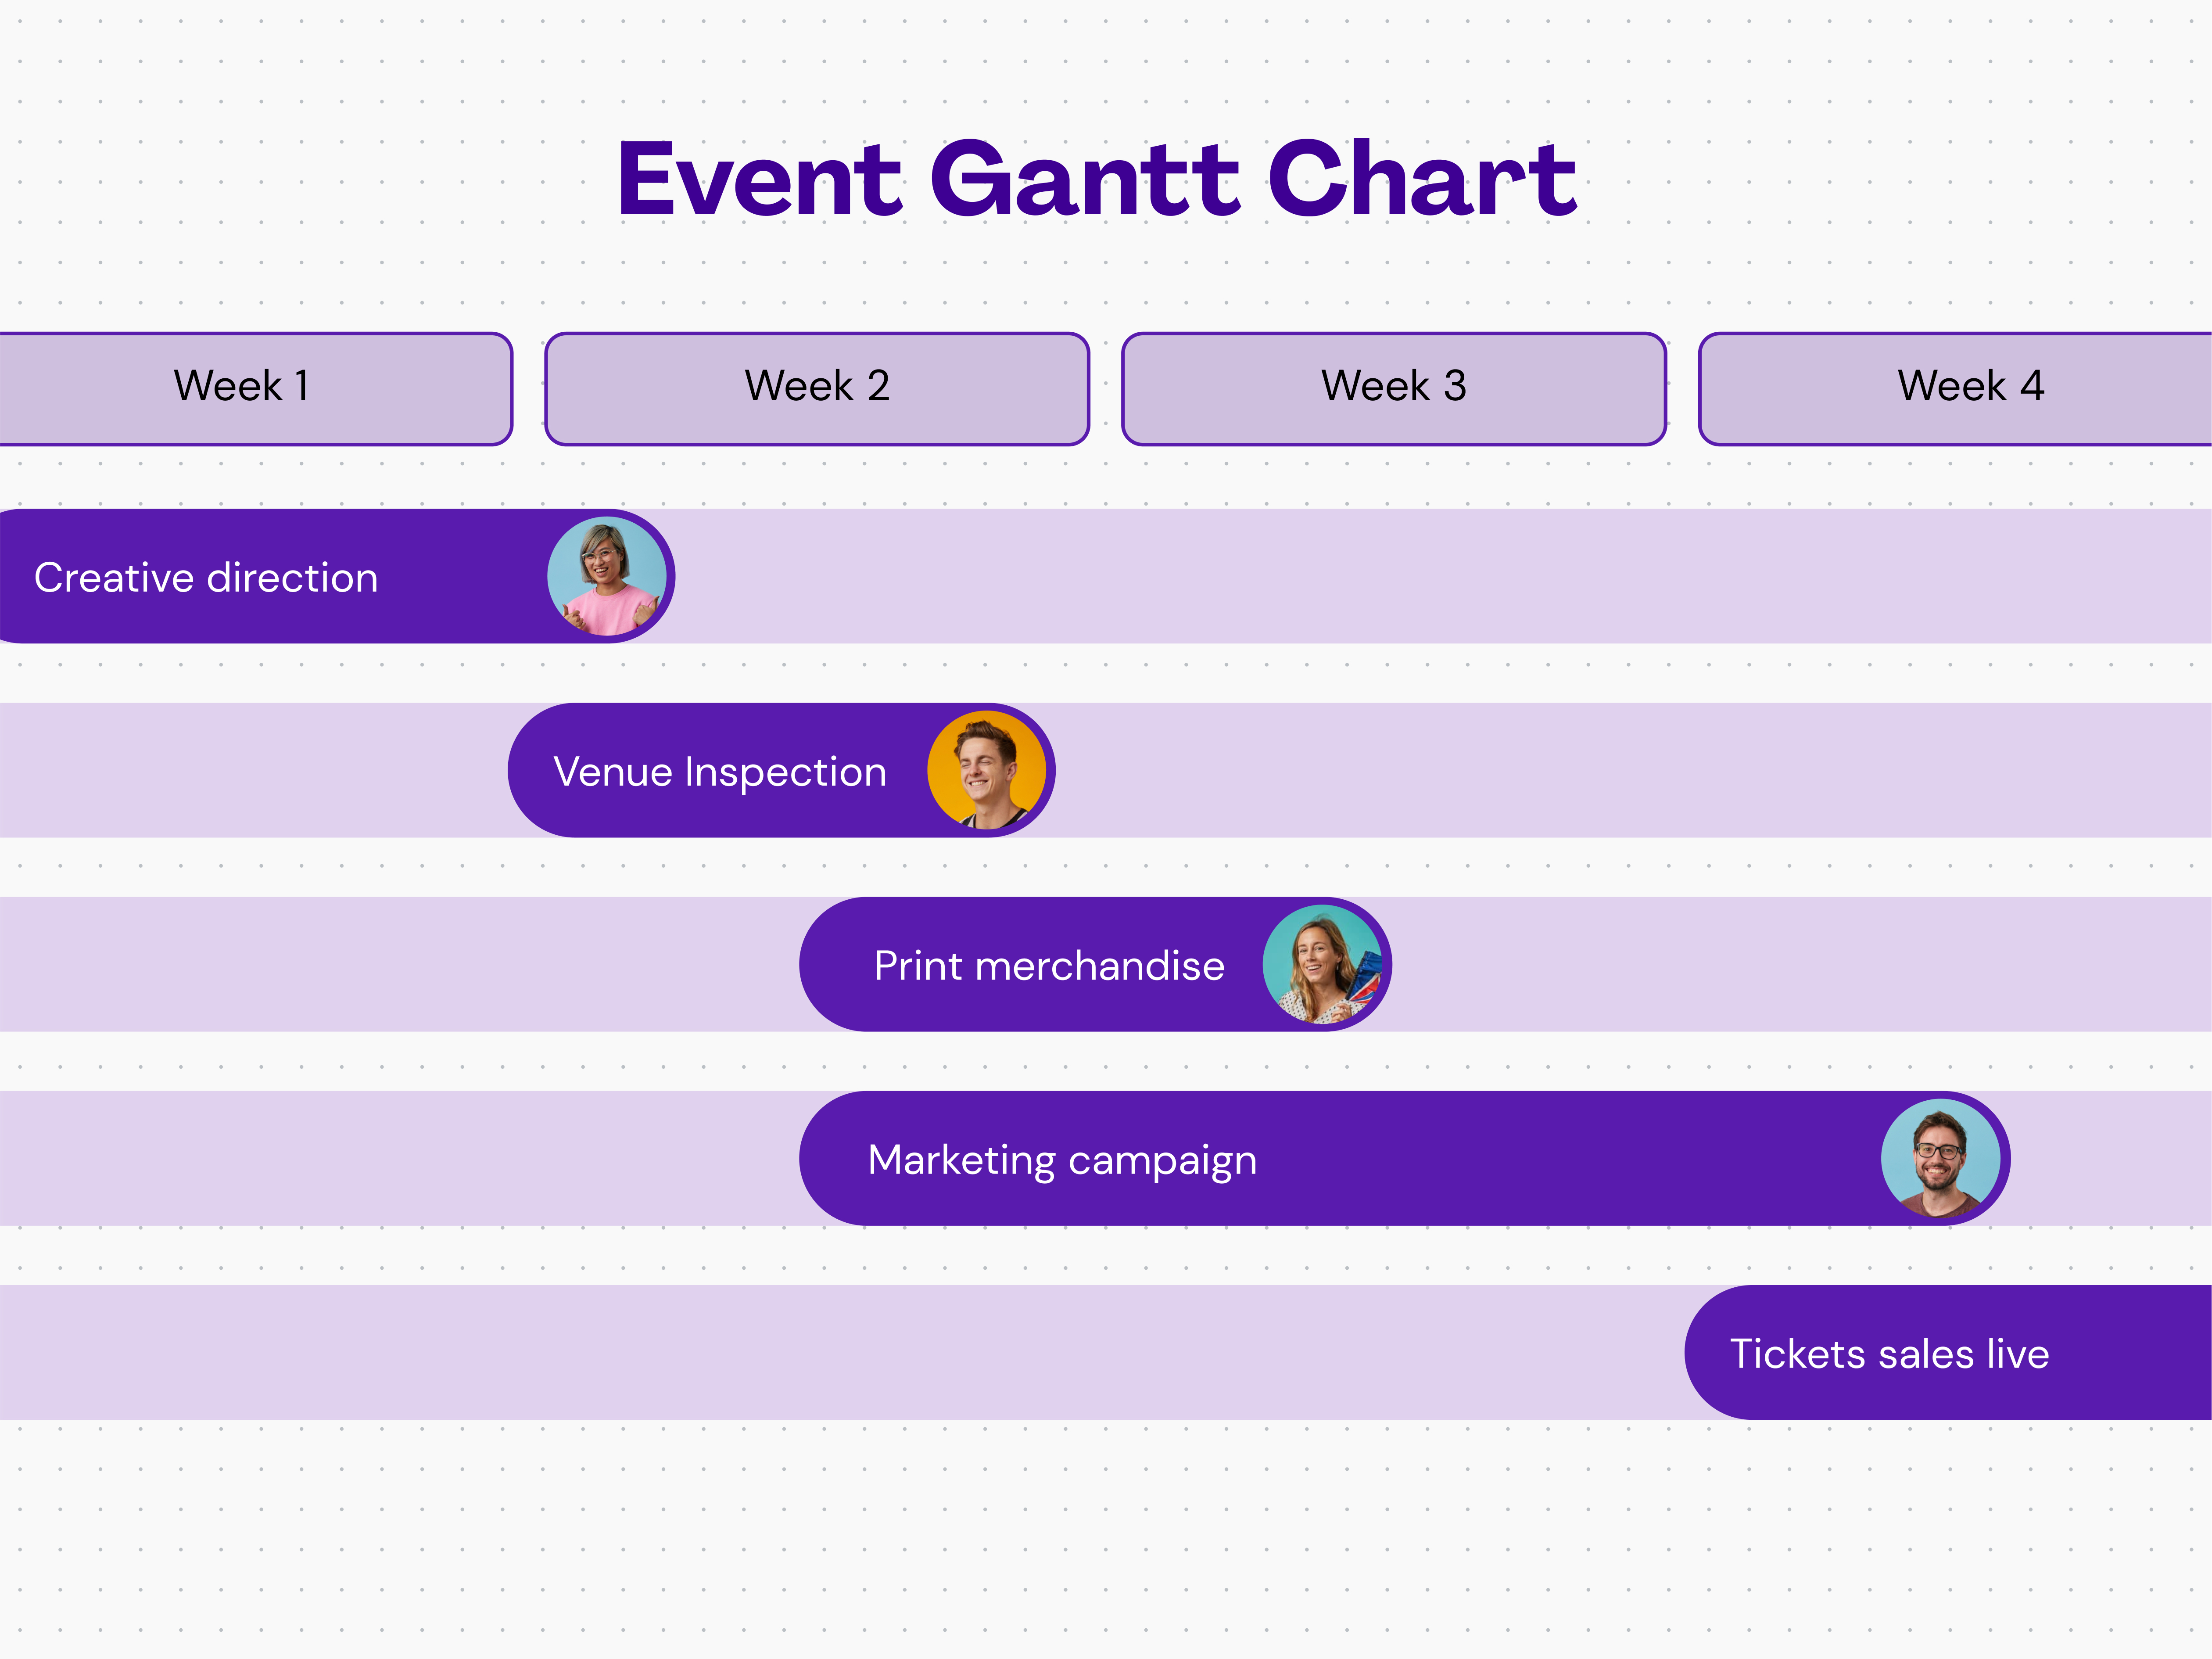
Example of a Gantt chart used in event planning.
Event planners use a Gantt chart to fulfill their clients’ goals and create a wonderful guest experience. A Gantt chart lists down their core activities, like reserving a venue, identifying the right vendors, finalizing the guest list, and promoting the event. Event planners, together with clients and vendors, refer to a Gantt chart to make sure everything is ready for the big day.
With a Gantt chart, a marketer easily maps out the steps of a social media campaign (researching the audience, creating a strategy, choosing the content type and format, promoting the content, and evaluating engagement) against the time frame of the campaign. Gantt charts are incredibly versatile; marketers can use them for different kinds of campaigns, from community management to influencer outreach.
Educators use Gantt charts to plot the curriculum of the entire school year. The Gantt chart allows them to plan lesson sequences in all the classes they handle. Gantt charts are also used in planning school competitions, internship worksheets, and major assessment tasks while taking note of summer vacations and holidays. In addition, academic researchers use Gantt charts to plan all the tasks needed for their research papers.
Engineers use a Gantt chart to guide them through the process-heavy software development life cycle (SDLC), which is how they create and deploy software. Gantt charts plot all SDLC phases, including planning, design, development, testing, deployment, and maintenance, so software dev teams can deliver quality products to their customers on time.
A Gantt chart helps a factory track the complex chain of manufacturing processes, from the purchase of raw materials to production to packaging and delivery. Because every activity is visible and scheduled, a Gantt chart helps factories stick to production schedules.
General contractors use a Gantt chart to map out the major phases of a construction project, starting with the initiation, pre-construction, procurement, construction, and post-construction. It’s a chart that everyone, including the subcontractors, engineers, architects, and clients, can refer to.
When not to use a Gantt chart?
Gantt charts are one of the best project management tools, but it’s not ideal for some situations. We don’t recommend Gantt charts if:
- You’re not finished with project discovery: The discovery phase is when you gather information about the project and define its scope. If you create a Gantt chart before project discovery, you might miss critical tasks and milestones. You likely end up redoing the entire Gantt chart. We recommend having a solid idea of key deliverables and an estimated timeline before making a Gantt chart.
- You want to check project costs and scope: The biggest strength of a Gantt chart is its time coordinate and the granularity of tasks. The downside, however, is that it provides little to no details on project scope(opens in a new tab or window) and finances. For project scope, a Gantt chart doesn’t offer specific details on key deliverables and success metrics. Similarly, teams often use other tools to manage costs.
Don’t worry, there are other tools and diagrams that can cover these gaps. After all, project managers often use a combination of visual charts and graphs to manage a single project.
For example, a project discovery may involve SWOT analysis(opens in a new tab or window), which helps teams maximize opportunities and prepare for pitfalls before committing to a project. Another popular discovery tool is the fishbone diagram(opens in a new tab or window), which helps project managers get to the root of an issue.
However, when the timescale is concerned, a Gantt chart is the way to go.
How to make a Gantt chart
Whether you’re a seasoned or beginner project manager, knowing how to make a Gantt chart will help you visualize your project timeline, break down tasks, and track progress easily.
In this section, we'll walk you through the steps needed to create a Gantt chart that will help you effectively manage any project.


Before creating a Gantt chart, it's important to clearly understand your project scope. The project scope outlines the goals, resources, and deliverables. It provides a clear vision and direction for everyone involved. This fundamental step lays the groundwork for your project and ensures everyone is on the same page when it comes to expectations and outcomes.
To define the project scope, communicate with stakeholders to determine their needs and objectives. Ensure each goal is measurable and achievable. Consider budget, time, or resource restrictions since these may impact the project's success.
By taking the time to craft a well-defined project scope, you'll be better equipped to develop an effective Gantt chart that will drive your project forward.
Next, identify all the tasks and activities needed to complete your project. Here, you’ll break down the project into individual tasks, which might include research, meetings, design work, and more. This helps you plan, organize, and allocate resources easier.
Make a list of what needs to be done and when. You can organize your list further by categorizing items into larger tasks and smaller subtasks. Try to put as much detail as possible so nothing is overlooked. Note the resources, skills, and time required per task.
To visualize the overall time frame of your project, set a start and end date for each individual task to be represented by horizontal bars. This provides a realistic estimate of how many days, weeks, or months a task or activity takes place, keeping everyone aligned on deadlines and important milestones. Bear in mind factors like the complexity of the task, resources available, and potential bottlenecks when mapping out your timeline.
You can assign a wider time range for larger tasks while being more specific with subtasks. If your project has a single final deadline, begin with the endpoint and work in reverse to establish the timeline. Remember to allow some flexibility in your timeline to accommodate any unexpected delays and changes.
Task dependencies represent the relationship between tasks within a project, and understanding these relationships is critical. Some tasks rely on completing previous tasks before they can be executed. Conversely, some tasks might be independent and can be carried out simultaneously.
Your Gantt chart must reflect these dependencies to accurately capture your project timeline.
Review your list of tasks and determine which tasks depend on others for start or completion. Then, visualize these dependencies with connecting arrows or lines. By identifying task dependencies in your Gantt chart, you can refine your timeline and keep your project running smoothly.
With the list of tasks and project timeline at hand, it’s time to allocate tasks to appropriate team members. Each task should be linked to the individual or group with the most suitable skills, experience, and workload. It’s also important to balance the workload evenly to avoid overburdening team members while underutilizing others.
Once tasks are assigned in your Gantt chart, you should have a comprehensive view of who’s doing what and when in your project timeline. Continue monitoring assignments, as changes in task requirements and team member availability may call for adjustments throughout the project.
Milestones are significant events or achievements that serve as checkpoints for evaluating your project’s progress. These can be the end of a critical phase, a major decision point, or reaching a certain target.
Mark them in your Gantt chart at appropriate points in the timeline. Use special icons like diamonds to differentiate them from regular task bars. You may include a brief description to provide clarity and context about its relevance to the project.
The Gantt chart is a living document you must monitor and update throughout the project lifecycle. Since projects often experience changes in timeline, resources, or task requirements, it's essential to keep your Gantt chart up-to-date to accurately reflect the state of the project.
Implement a regular review process (either weekly or monthly) based on the project's duration and complexity. During these evaluations, assess the progress of tasks and milestones with the set timeline, and update the Gantt chart to reflect any changes.
Gantt chart upkeep allows you to spot potential issues early and adjust as needed to keep the project on track. Regular updates to the Gantt chart also ensure that all team members remain informed about the project's progress and any changes that might impact their roles and areas of responsibility.
Get inspired with Gantt chart templates
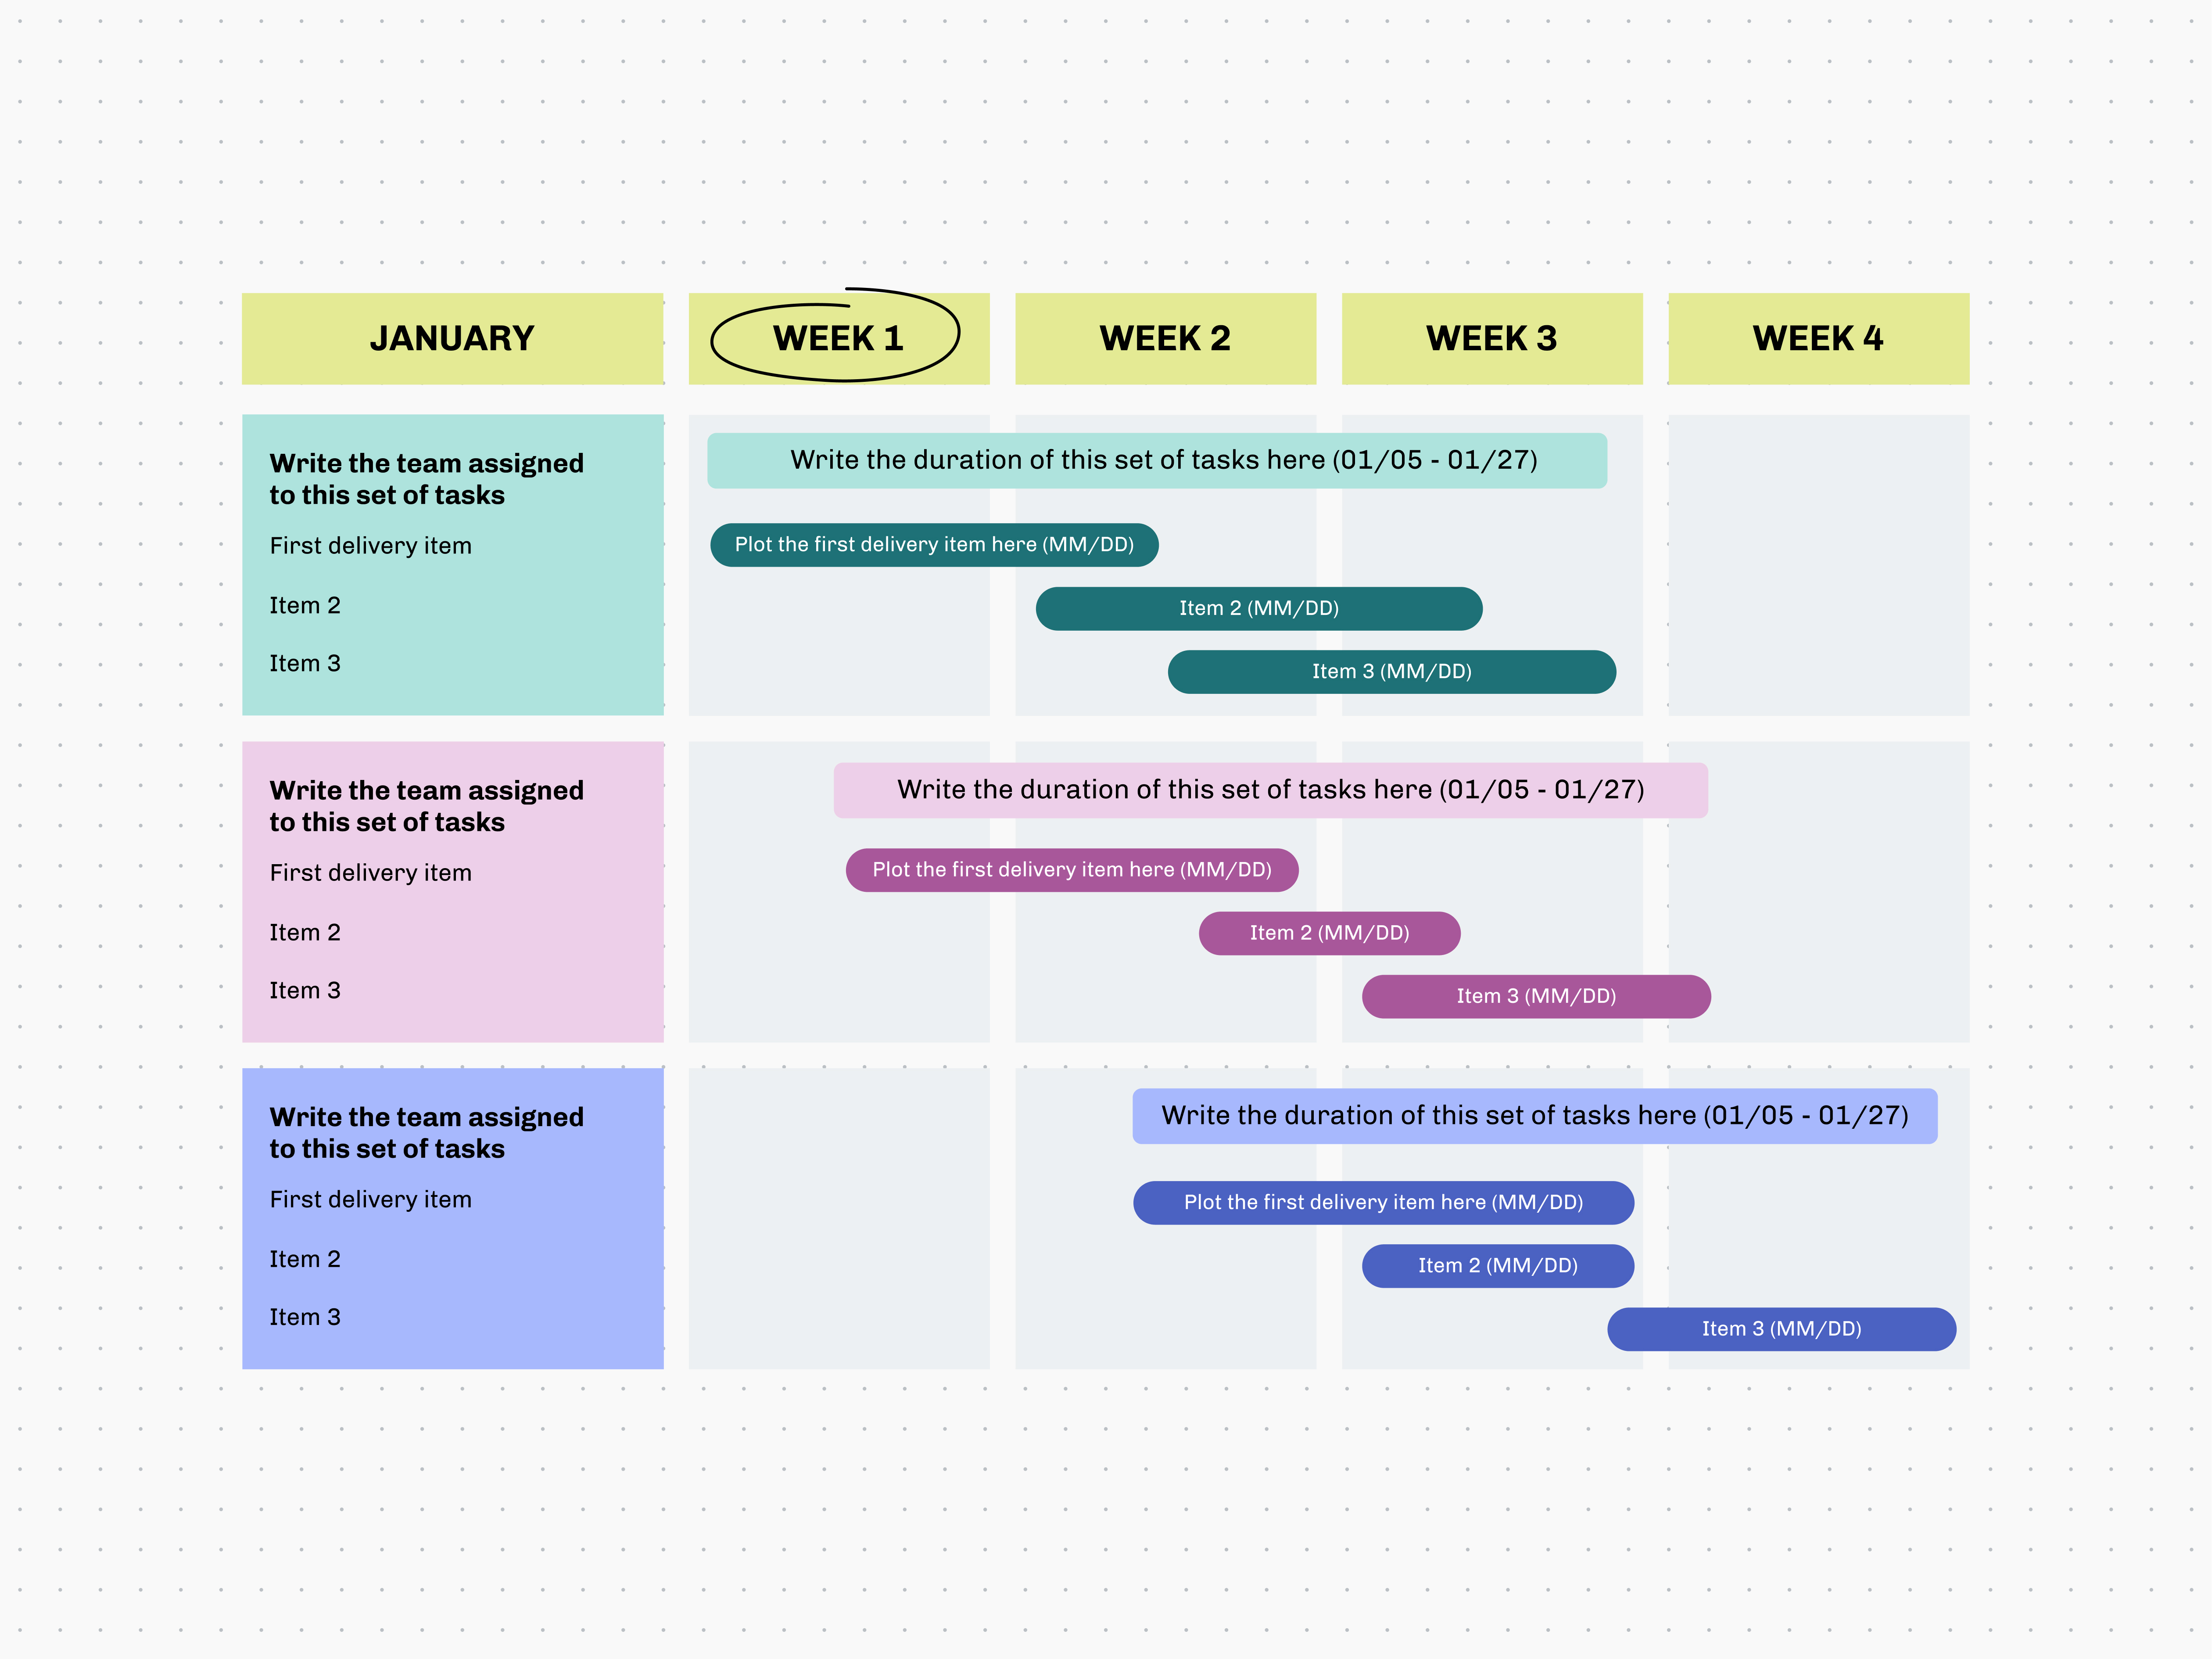
Get the ball rolling with these customizable Gantt charts. With your team, choose a Gantt chart template, list down your tasks, and edit the timeline and bars. Then add details pertinent to your project, like milestones, assignees, and dependencies.

All you need in a Gantt chart maker
Create clear, complete Gantt charts with a suite of chart-building tools. Our free Gantt chart maker lets your team map out a project timeline, identify critical task sequences, and meet demanding deadlines. And with an infinite canvas, you can make a Gantt chart for your biggest projects.

Unlimited space for unlimited ideas
With a free infinite canvas and unlimited number of whiteboards, fully develop your ideas and still have room

Your ideas visualized
Build stunning tables and graphs with automatic flowcharts, or sketch them to life with Draw.

All your work, in one place
From plan to execution, it’s all here. Take notes, brainstorm, collaborate, and more on the same whiteboard.

Workshop ideas to perfection
With your team, develop ideas through comments and stickies, and keep sync sessions on track with a timer.

Share your work effortlessly
Share a link to your doc and control your team's access. Present directly from the editor with Presenter view.

Expand your Presentation to a Whiteboard
With just a single click, expand your presentation slides into infinite, collaborative whiteboards.
Gantt chart best practices
Follow these best practices when you make and update your chart, so you can maximize the benefits of a Gantt chart and ensure project success.
Include small details
When it comes to Gantt charts, the devil is truly in the details. Add finer aspects of your project in your Gantt chart, including descriptions of each task, estimated durations, creative briefs, notes, and key files that are relevant and helpful to the assigned team members.
By including these granular details, you can turn your Gantt chart into a one-stop source for everything related to your project, minimizing confusion and enhancing clarity among team members.
Additionally, you can use labels and color coding to your advantage to make this detailed information easier to understand. However, remember to strike a balance between providing sufficient detail and maintaining a clear, uncluttered Gantt chart.
Strengthen your Gantt chart by adding relevant details and notes.
Segment large tasks
Projects often have complex, sizeable tasks involving multiple team members and departments. By breaking down these tasks into smaller, more manageable subtasks, you can better understand the steps needed to complete each task, making it easier to estimate resources and monitor progress. It also helps reduce the risk of neglecting key project components and leads to more meticulous planning and execution.
Practice breaking down large tasks into smaller, actionable steps and ensure each step has a clear goal, assigned team member, and estimated duration. This process will not only make your Gantt chart more structured and organized, but it also improves team communication and collaboration.
Watch your dependencies
If you don’t account for dependencies, delays and conflicts can throw your entire project off schedule. Keep a close watch on your dependencies and ensure any change in one task including its impact on other tasks is reflected accurately in your Gantt chart.
There are four main types of task dependencies:
- Finish to start (FS): This is the most common type of task dependency. Here, the initial task must be completed before the preceding task can begin. Task A must be completed before Task B can begin.
- Start to start (SS): The preceding task can only begin once the initial task has started. Both tasks can run simultaneously. Task B can begin as long as Task A has started.
- Finish to finish (FF): The initial task must be completed before the preceding task can be finished. Task A must be completed before Task B can be finished.
- Start to finish (SF): This is the least common type of dependency. The initial task can’t be finished until the preceding task has started. Task A can’t be completed before Task B begins.
Track non-work periods
Accounting for non-work periods is crucial for creating an effective Gantt chart. Non-work periods include any time off that impacts your project timeline, like:
- Weekends
- Holidays
- Scheduled vacations
By tracking non-work periods in your Gantt chart, you can more accurately estimate task durations, allocate resources, and avoid conflicts that may cause delays and overworked team members.
Identify all holidays, scheduled time off, and other periods where team members are unavailable to work. Add this information to your Gantt chart by modifying each task's start and end dates. This helps you set a realistic timeline for when the project is completed and manage expectations among stakeholders.
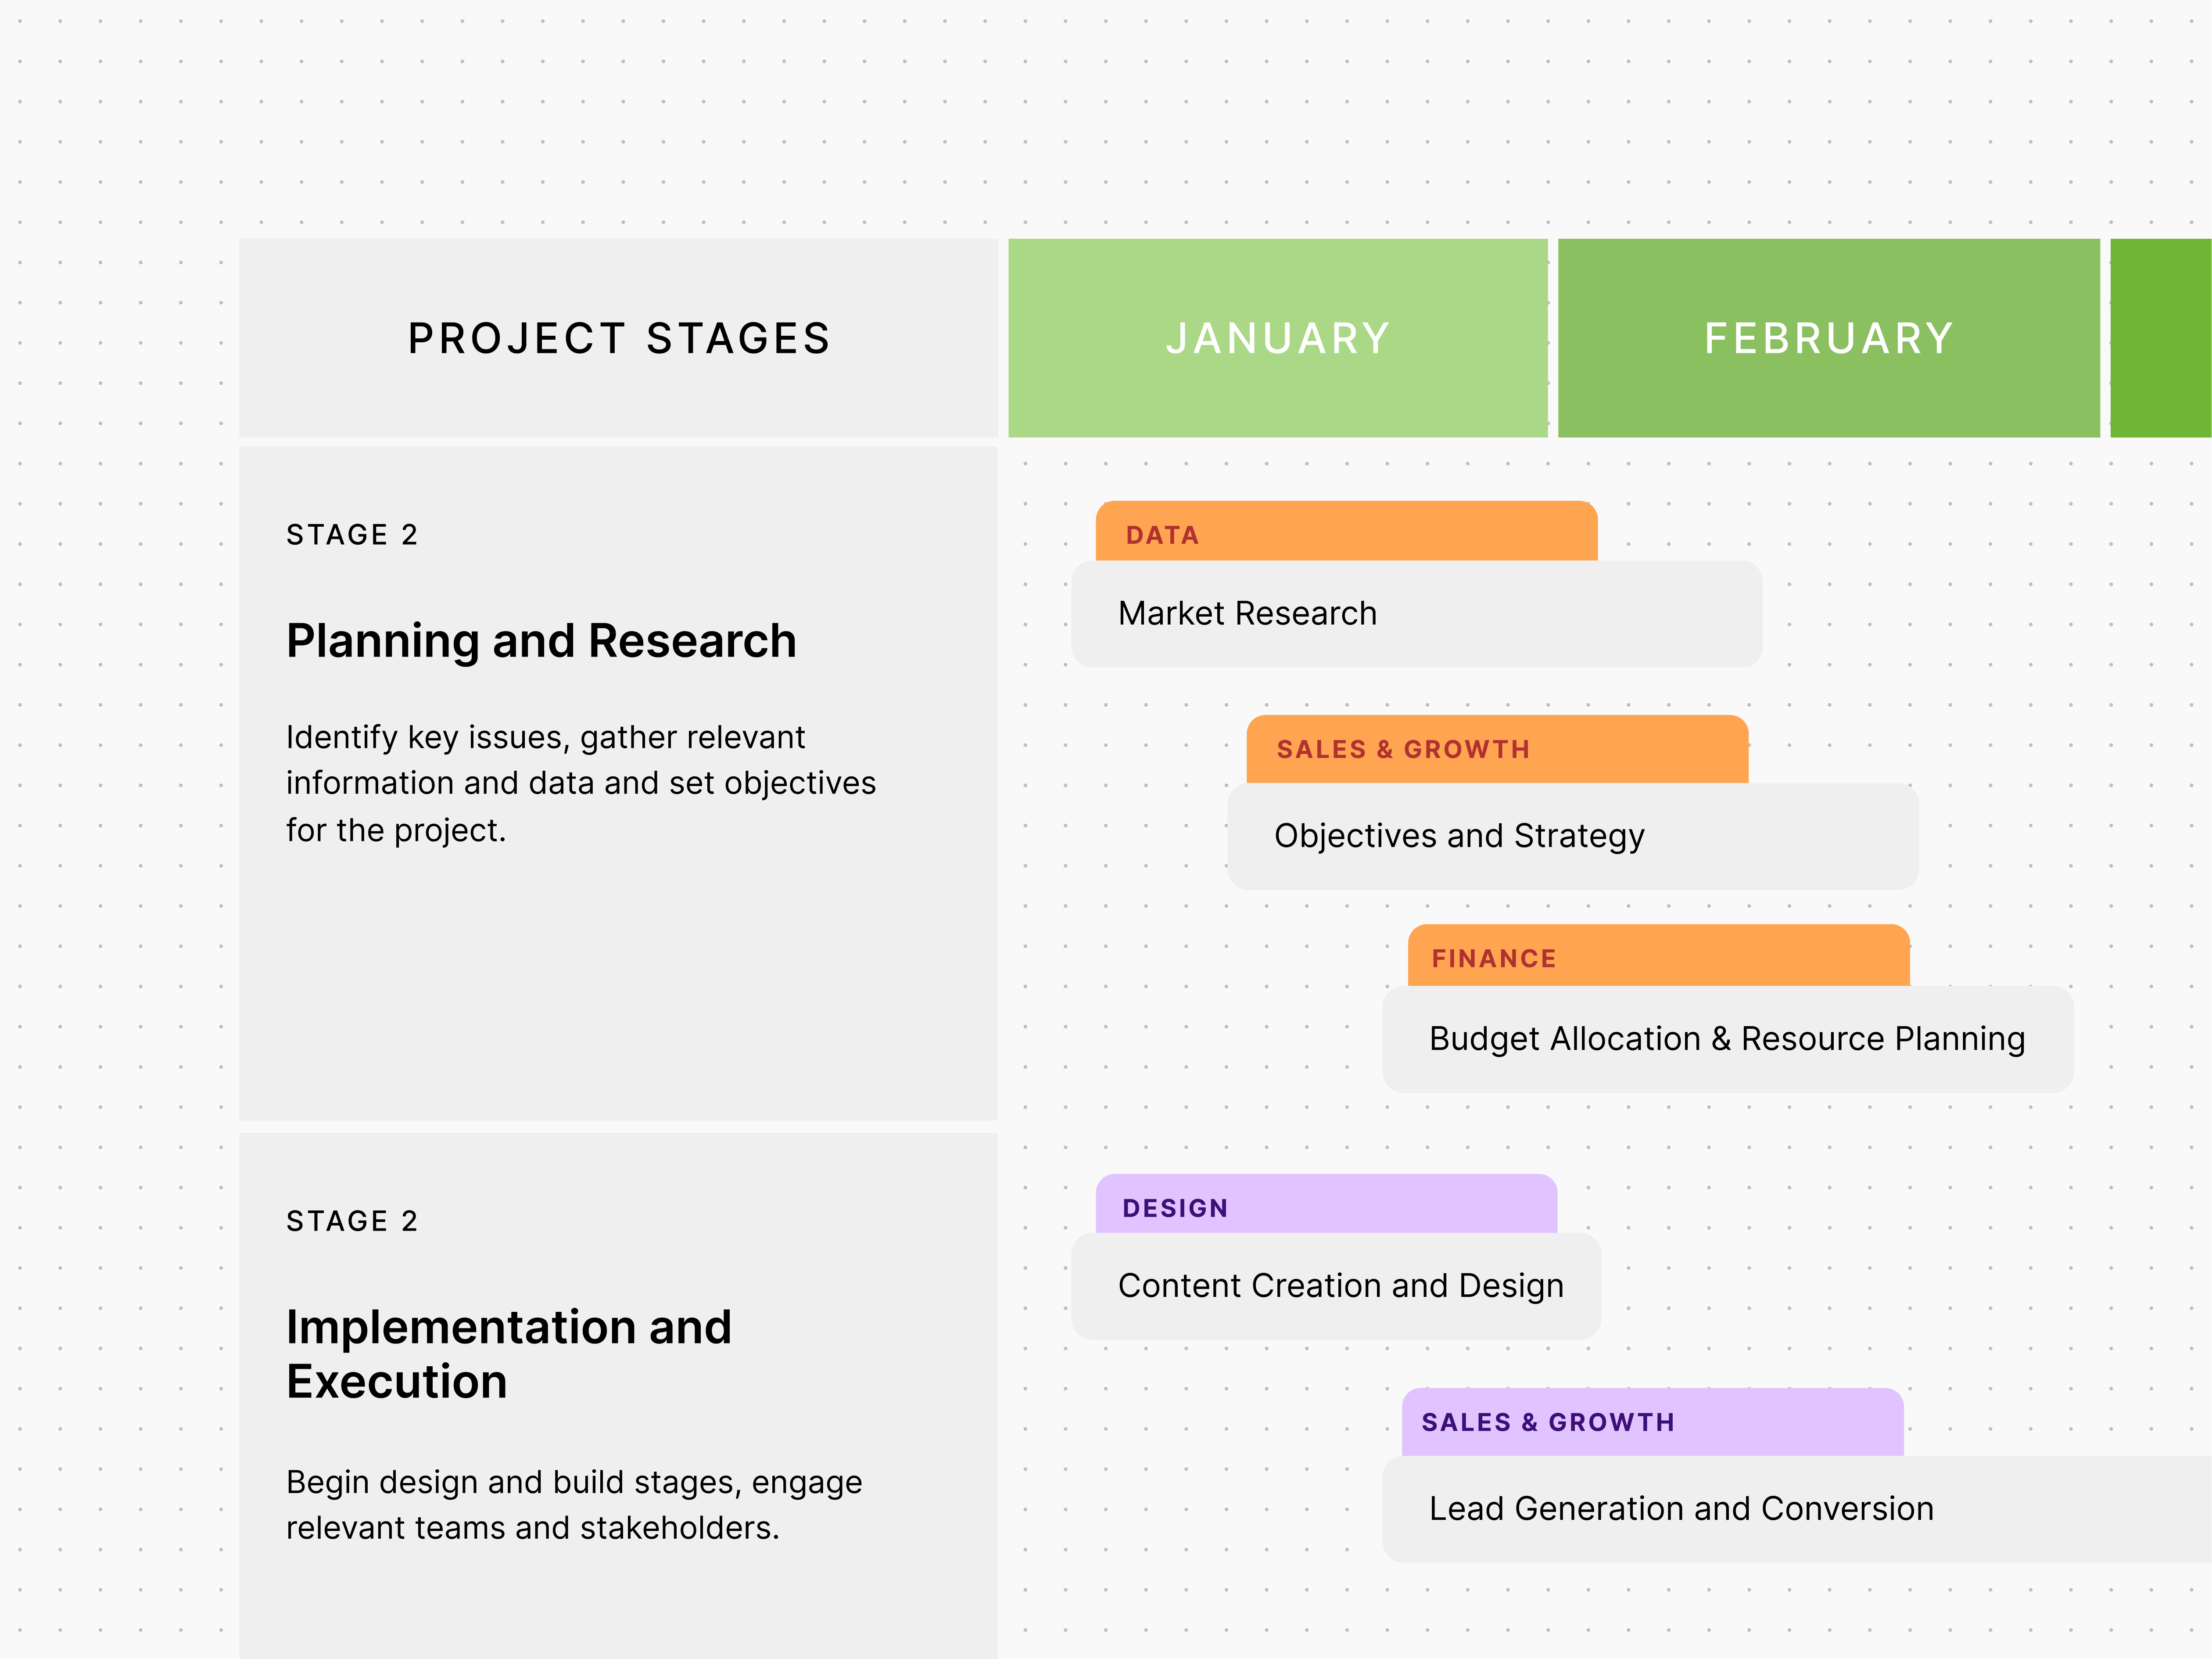
Apply colors to visualize information
Using colors in your Gantt chart can significantly enhance its readability and effectiveness. Colors are an intuitive way to differentiate, categorize, and visualize elements in your chart, making it easier for team members and stakeholders to understand information and their responsibilities.
For instance, you can use different colors to represent tasks, statuses (to do, in progress, done), departments, or teams.
When applying colors to your Gantt chart, keep it simple and consistent. Avoid using too many colors or overly complicated color schemes, as this can make the chart difficult to read. Instead, opt for a clear color palette that effectively relays the needed information without overwhelming the viewer.

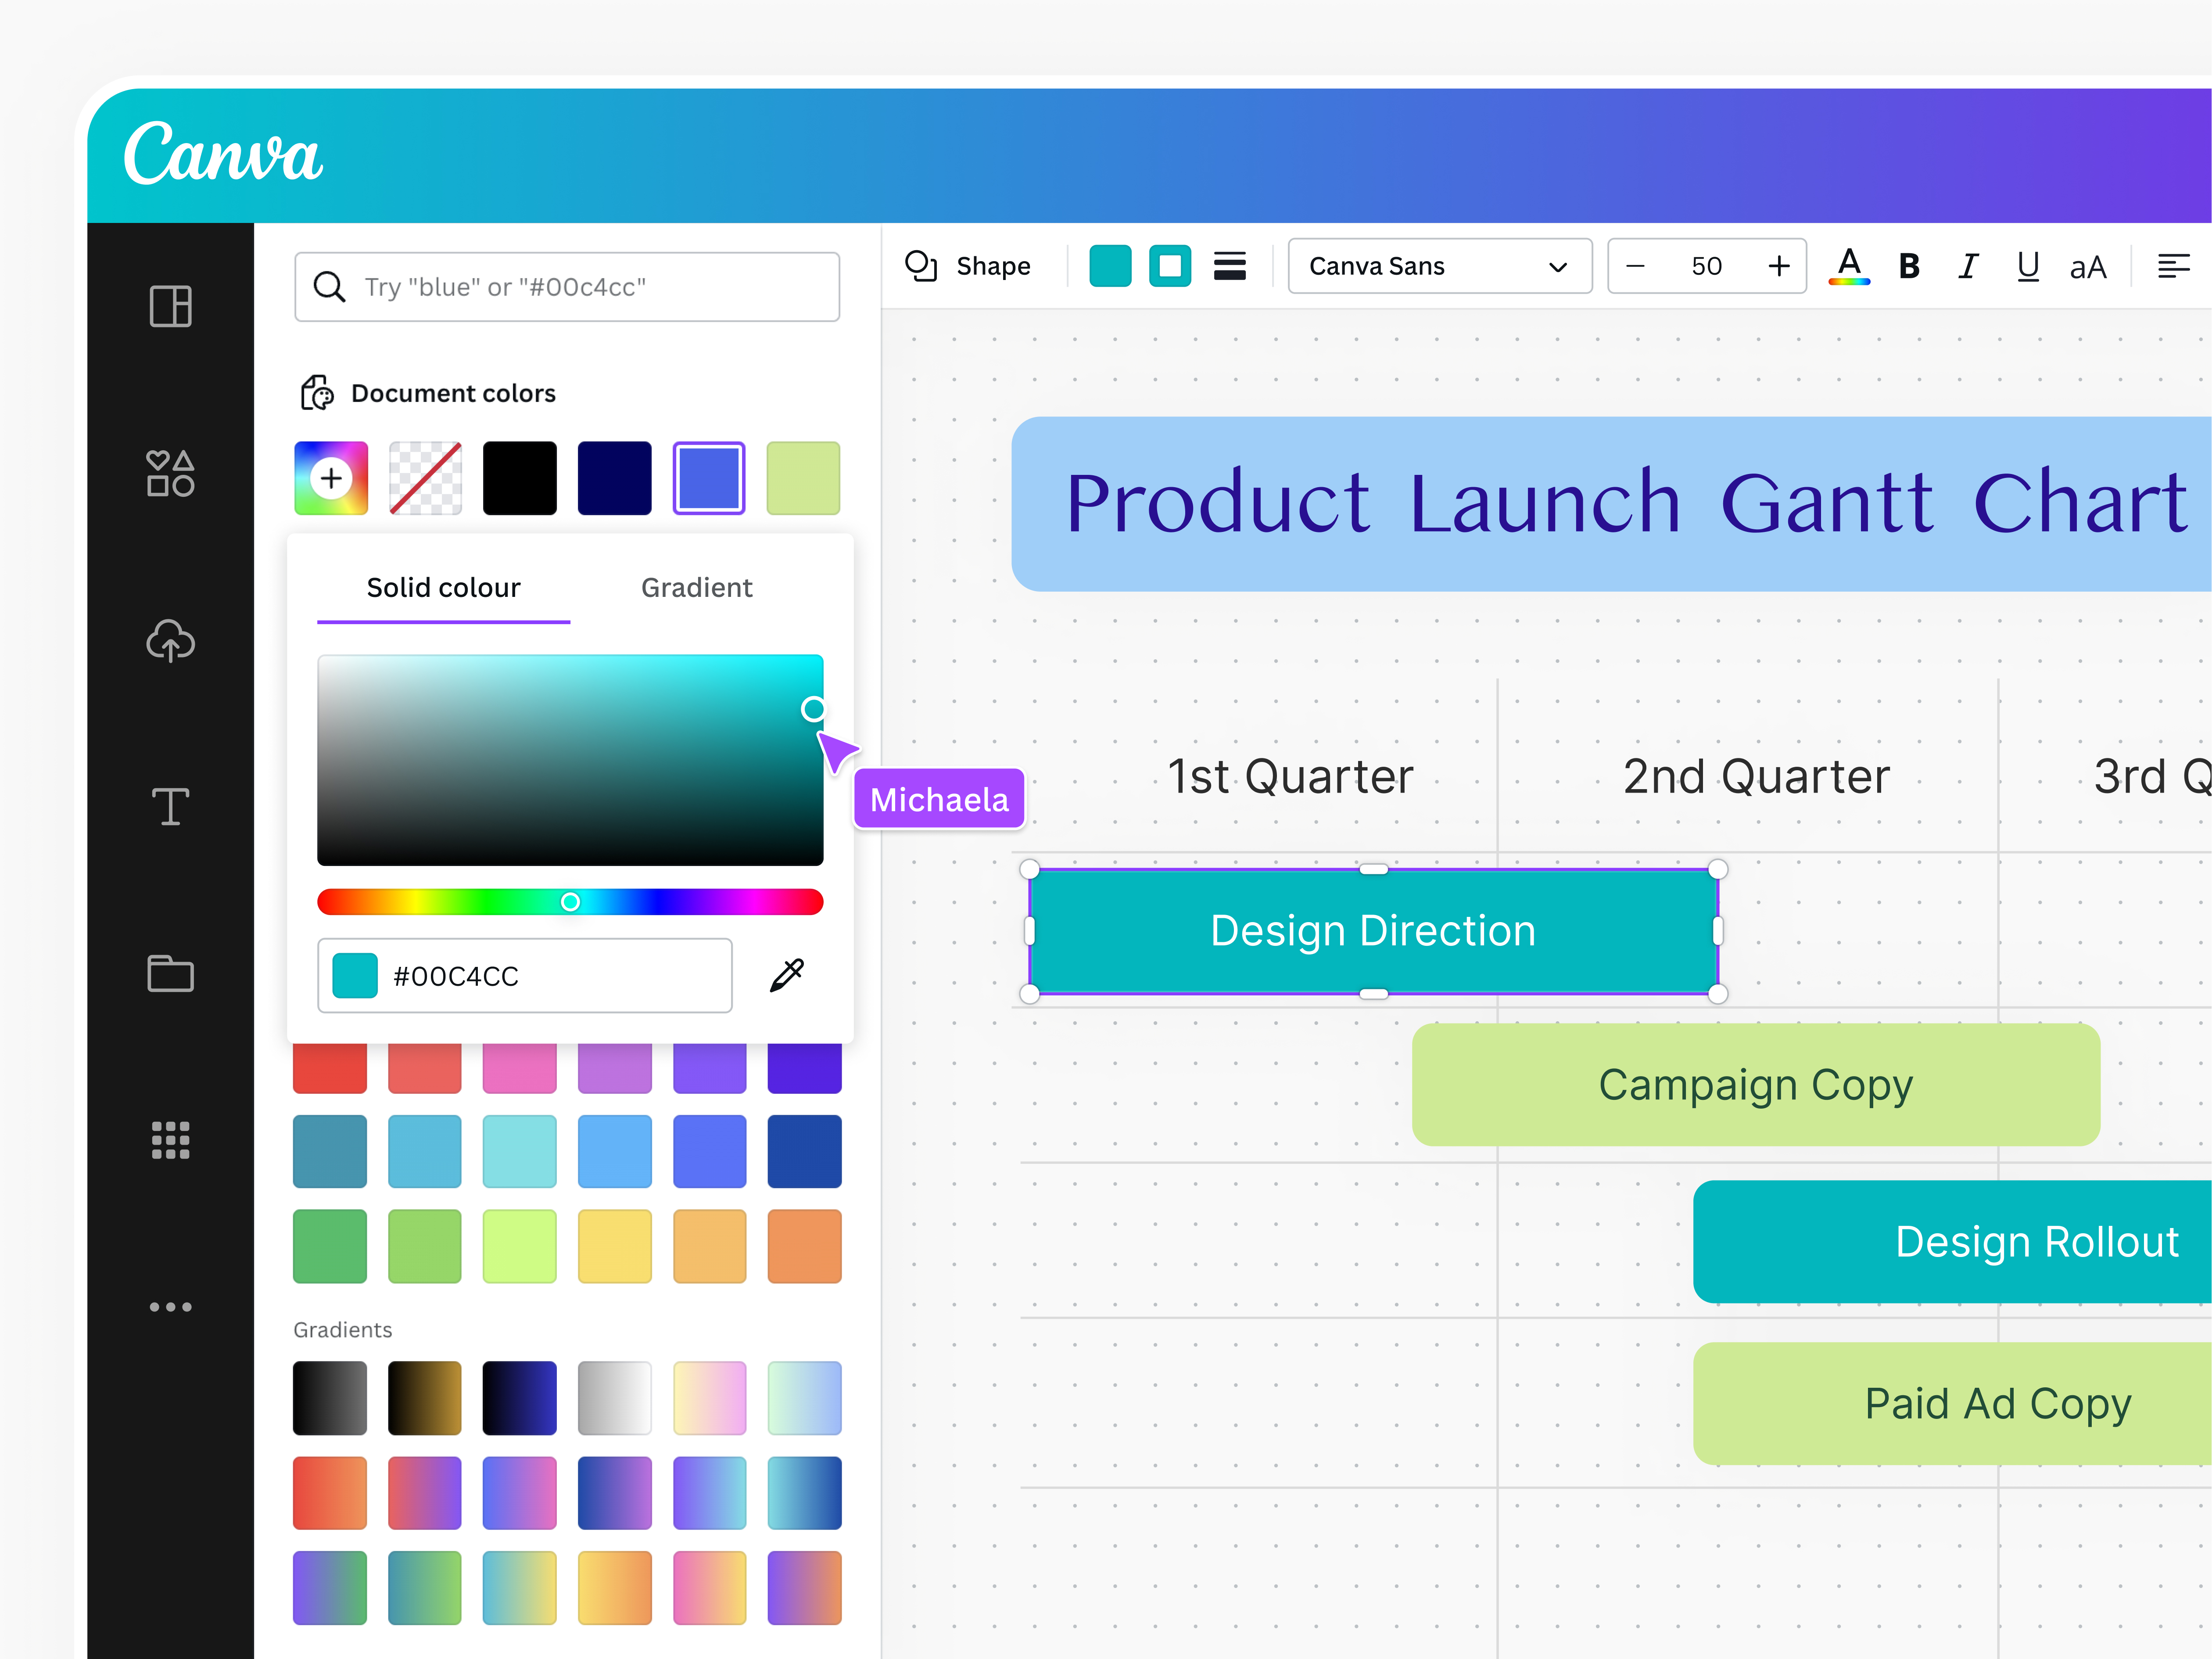
Use colors in your Gantt chart to visually differentiate tasks.
Gantt chart FAQs
Gantt charts are used in project management, specifically to visualize project tasks (usually broken down into subtasks) and their duration against the project time frame. A Gantt chart provides a bird’s eye view of the project: it’s used to see all activities in the timeline, their progress, important milestones, and the people responsible for each task. Teams use it to schedule tasks, manage delays, and allocate resources optimally.
It’s super easy to make a Gantt chart using our digital whiteboard. Just choose a Gantt chart template from our gallery and customize away. Add your project tasks, edit the task bars, customize the timeline, change the colors, and make sure the Gantt chart covers your project scope. You can share the link with your teammates, too, so they too can see and edit the Gantt chart as needed.
A Gantt chart is helpful because it provides a high-level overview of the timeline and activities of a project, so you can easily identify what’s going on at any given point. It helps you schedule and track tasks under a project, especially if there are tasks dependent on the completion of other tasks.
Some of the many advantages of Gantt charts include clearly representing the project tasks, showing the timescale, and tracking the project. Plus, it’s easy to present during meetings and share with different stakeholders, no matter the level of participation.
There are downsides, however. Some disadvantages of Gantt charts include:
- It provides limited information on costs and resources needed for each task
- In complex projects, it can take a while to build a comprehensive Gantt chart
- You must have complete project information before you can start making one
Don’t worry, there are workarounds and other project management tools available to cover these gaps.
The right Gantt chart tool will help you build clear charts fast. When looking for a Gantt chart maker, ensure that the tool:
- Has an intuitive, user-friendly interface with vertical lines marking the start and end dates
- Allows you to drag and drop as many bars and milestones as the project demands
- Lets you create as big of a timeline as needed
- Makes it easy to add arrows to depict task sequences
- Allows easy collaboration or retrospective(opens in a new tab or window) with teammates, so you can work on the Gantt chart together
- Makes it easy to share Gantt charts with stakeholders
Was this page helpful?
Plan better with Gantt charts