- Fishbone Diagram
Fishbone diagrams
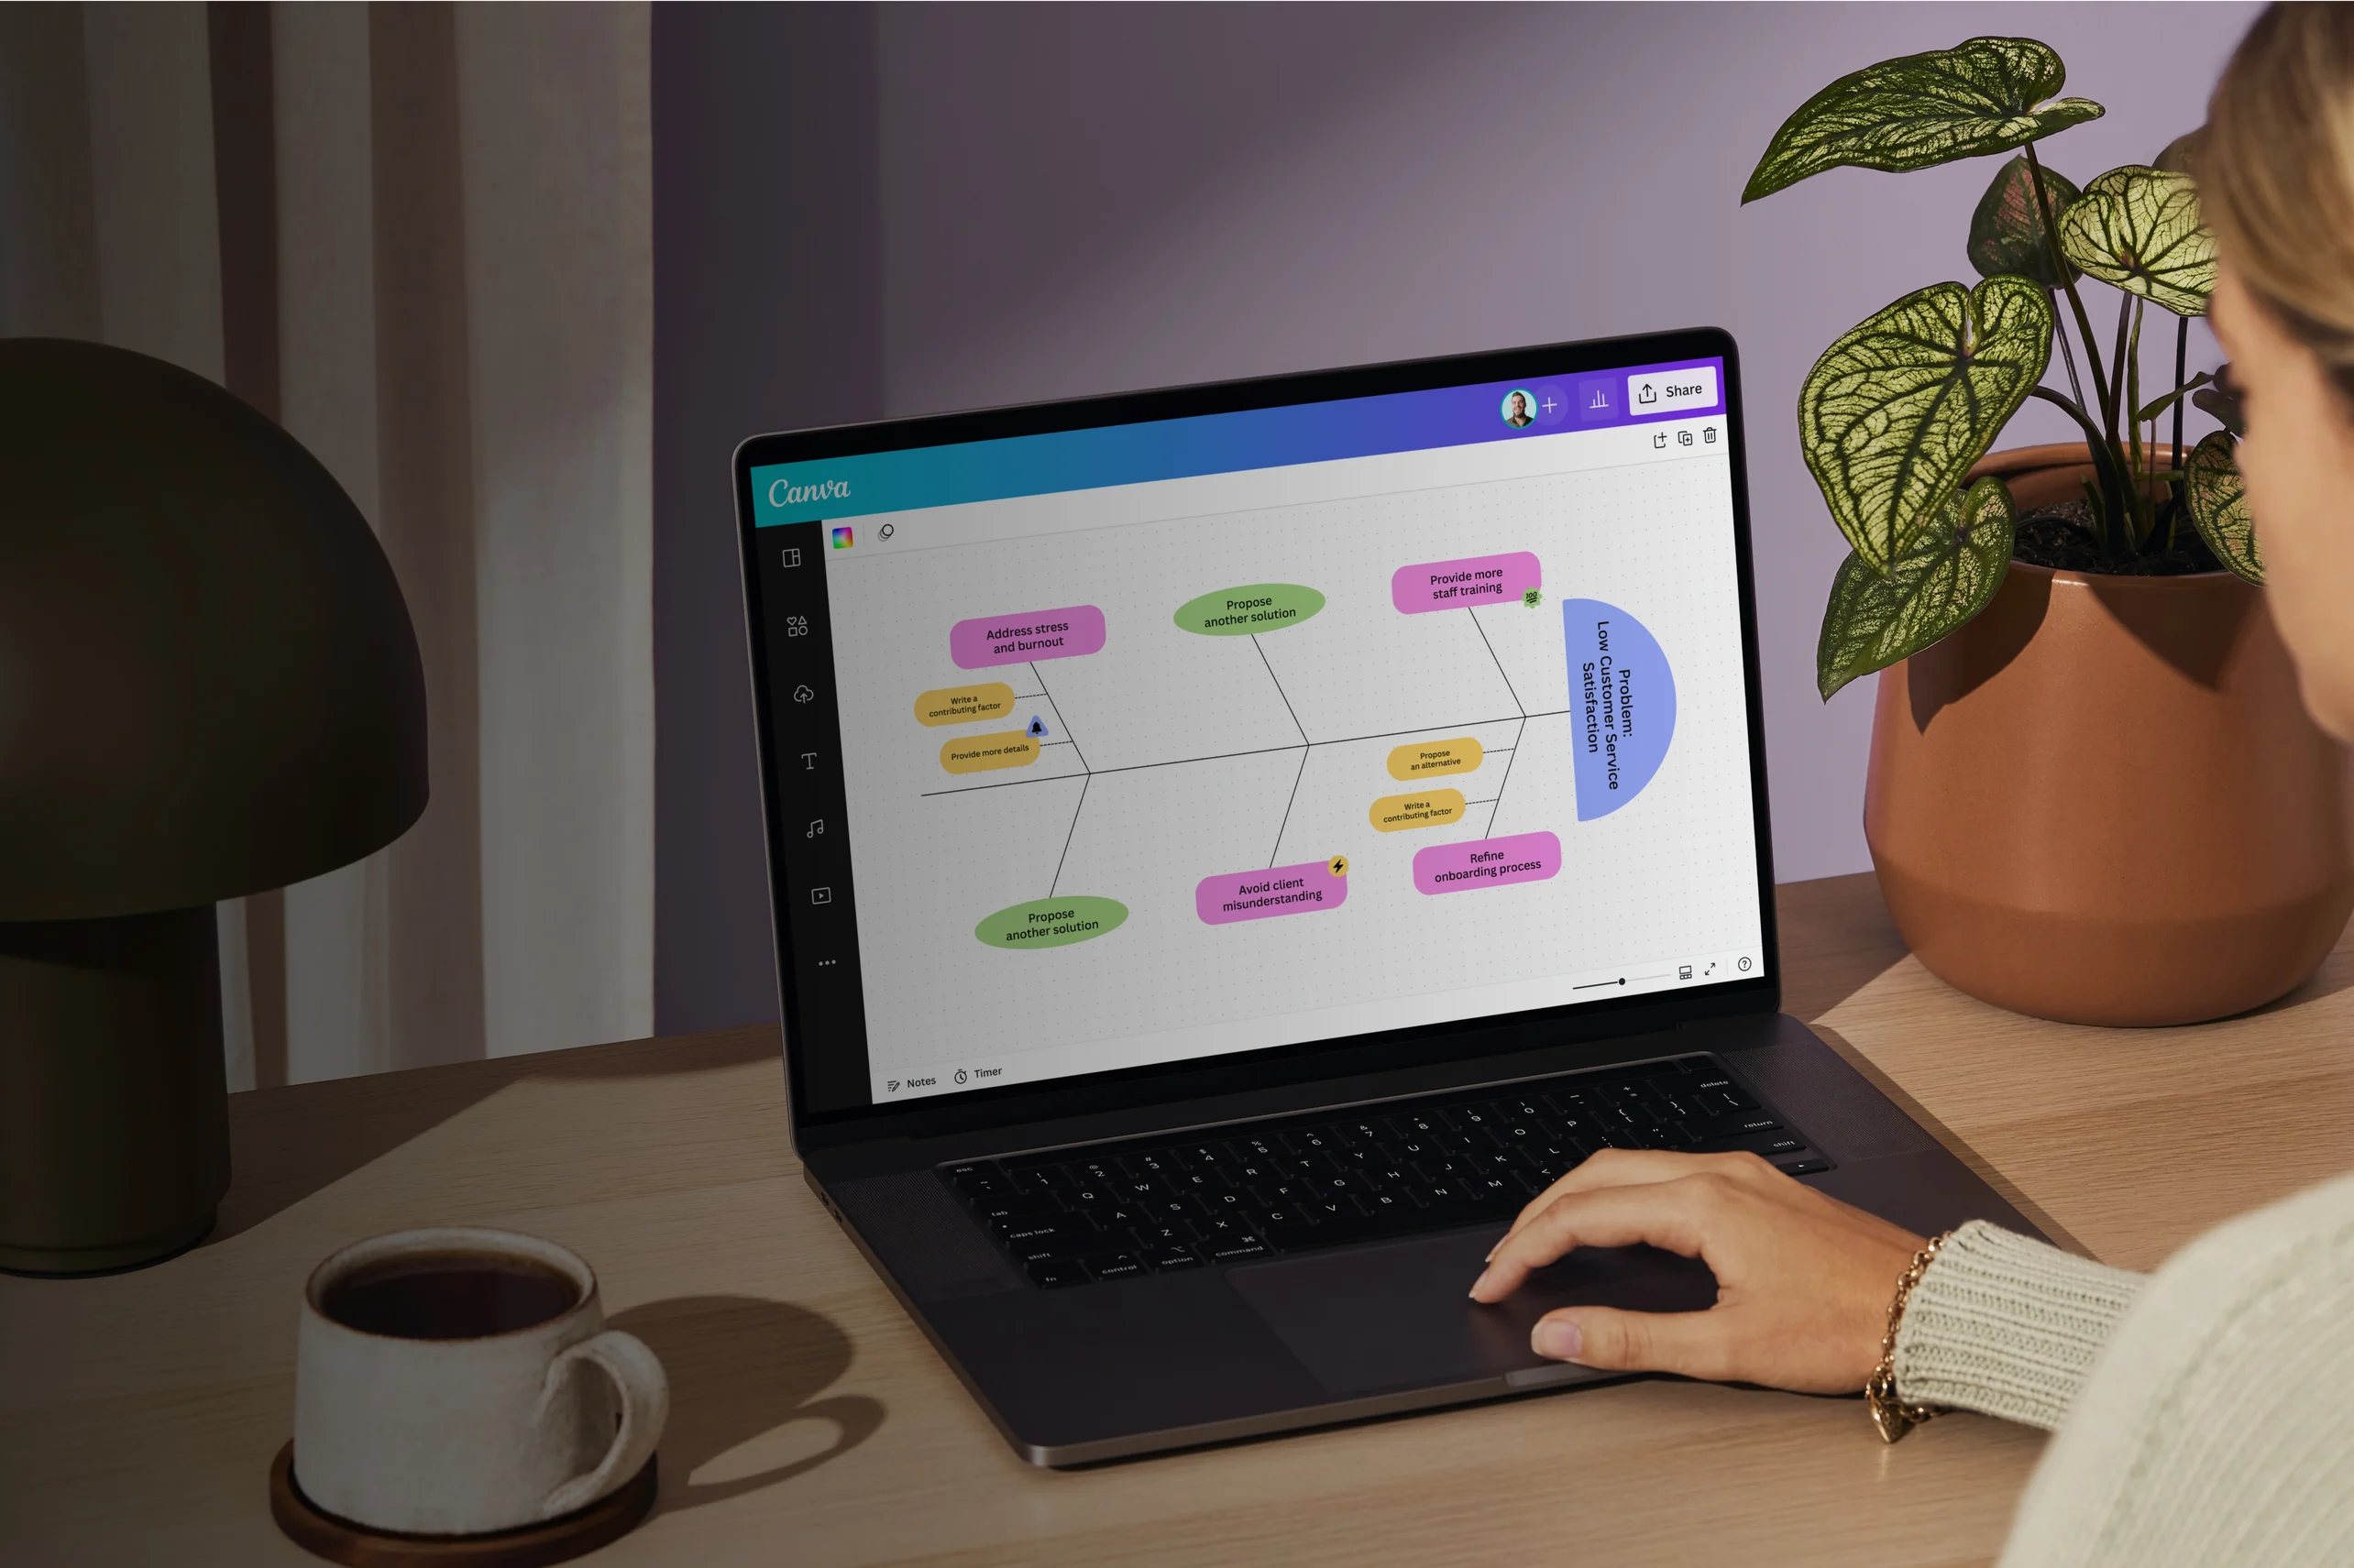
Create a fishbone diagram online
Whether you’re attempting to solve a problem on your own or with a team, it helps to visualize your ideas. With our fishbone diagram maker, you can root out causes for existing and future problems and organize all your data in a format that just makes sense. Canva Whiteboards gives you editable templates, visualization and collaboration tools, and all the space you need to get to the meat of any issue.
Infinite space made for unlimited ideas
Professionally designed templates to fast-track your workflow
Share and ideate with anyone, anytime, on any device
Run a workshop with whiteboard elements, sticky notes, and a timer
Embed your fishbone diagram in Docs, presentations, and more easily
Easy online whiteboard tools and data visualization
How to create a fishbone diagram

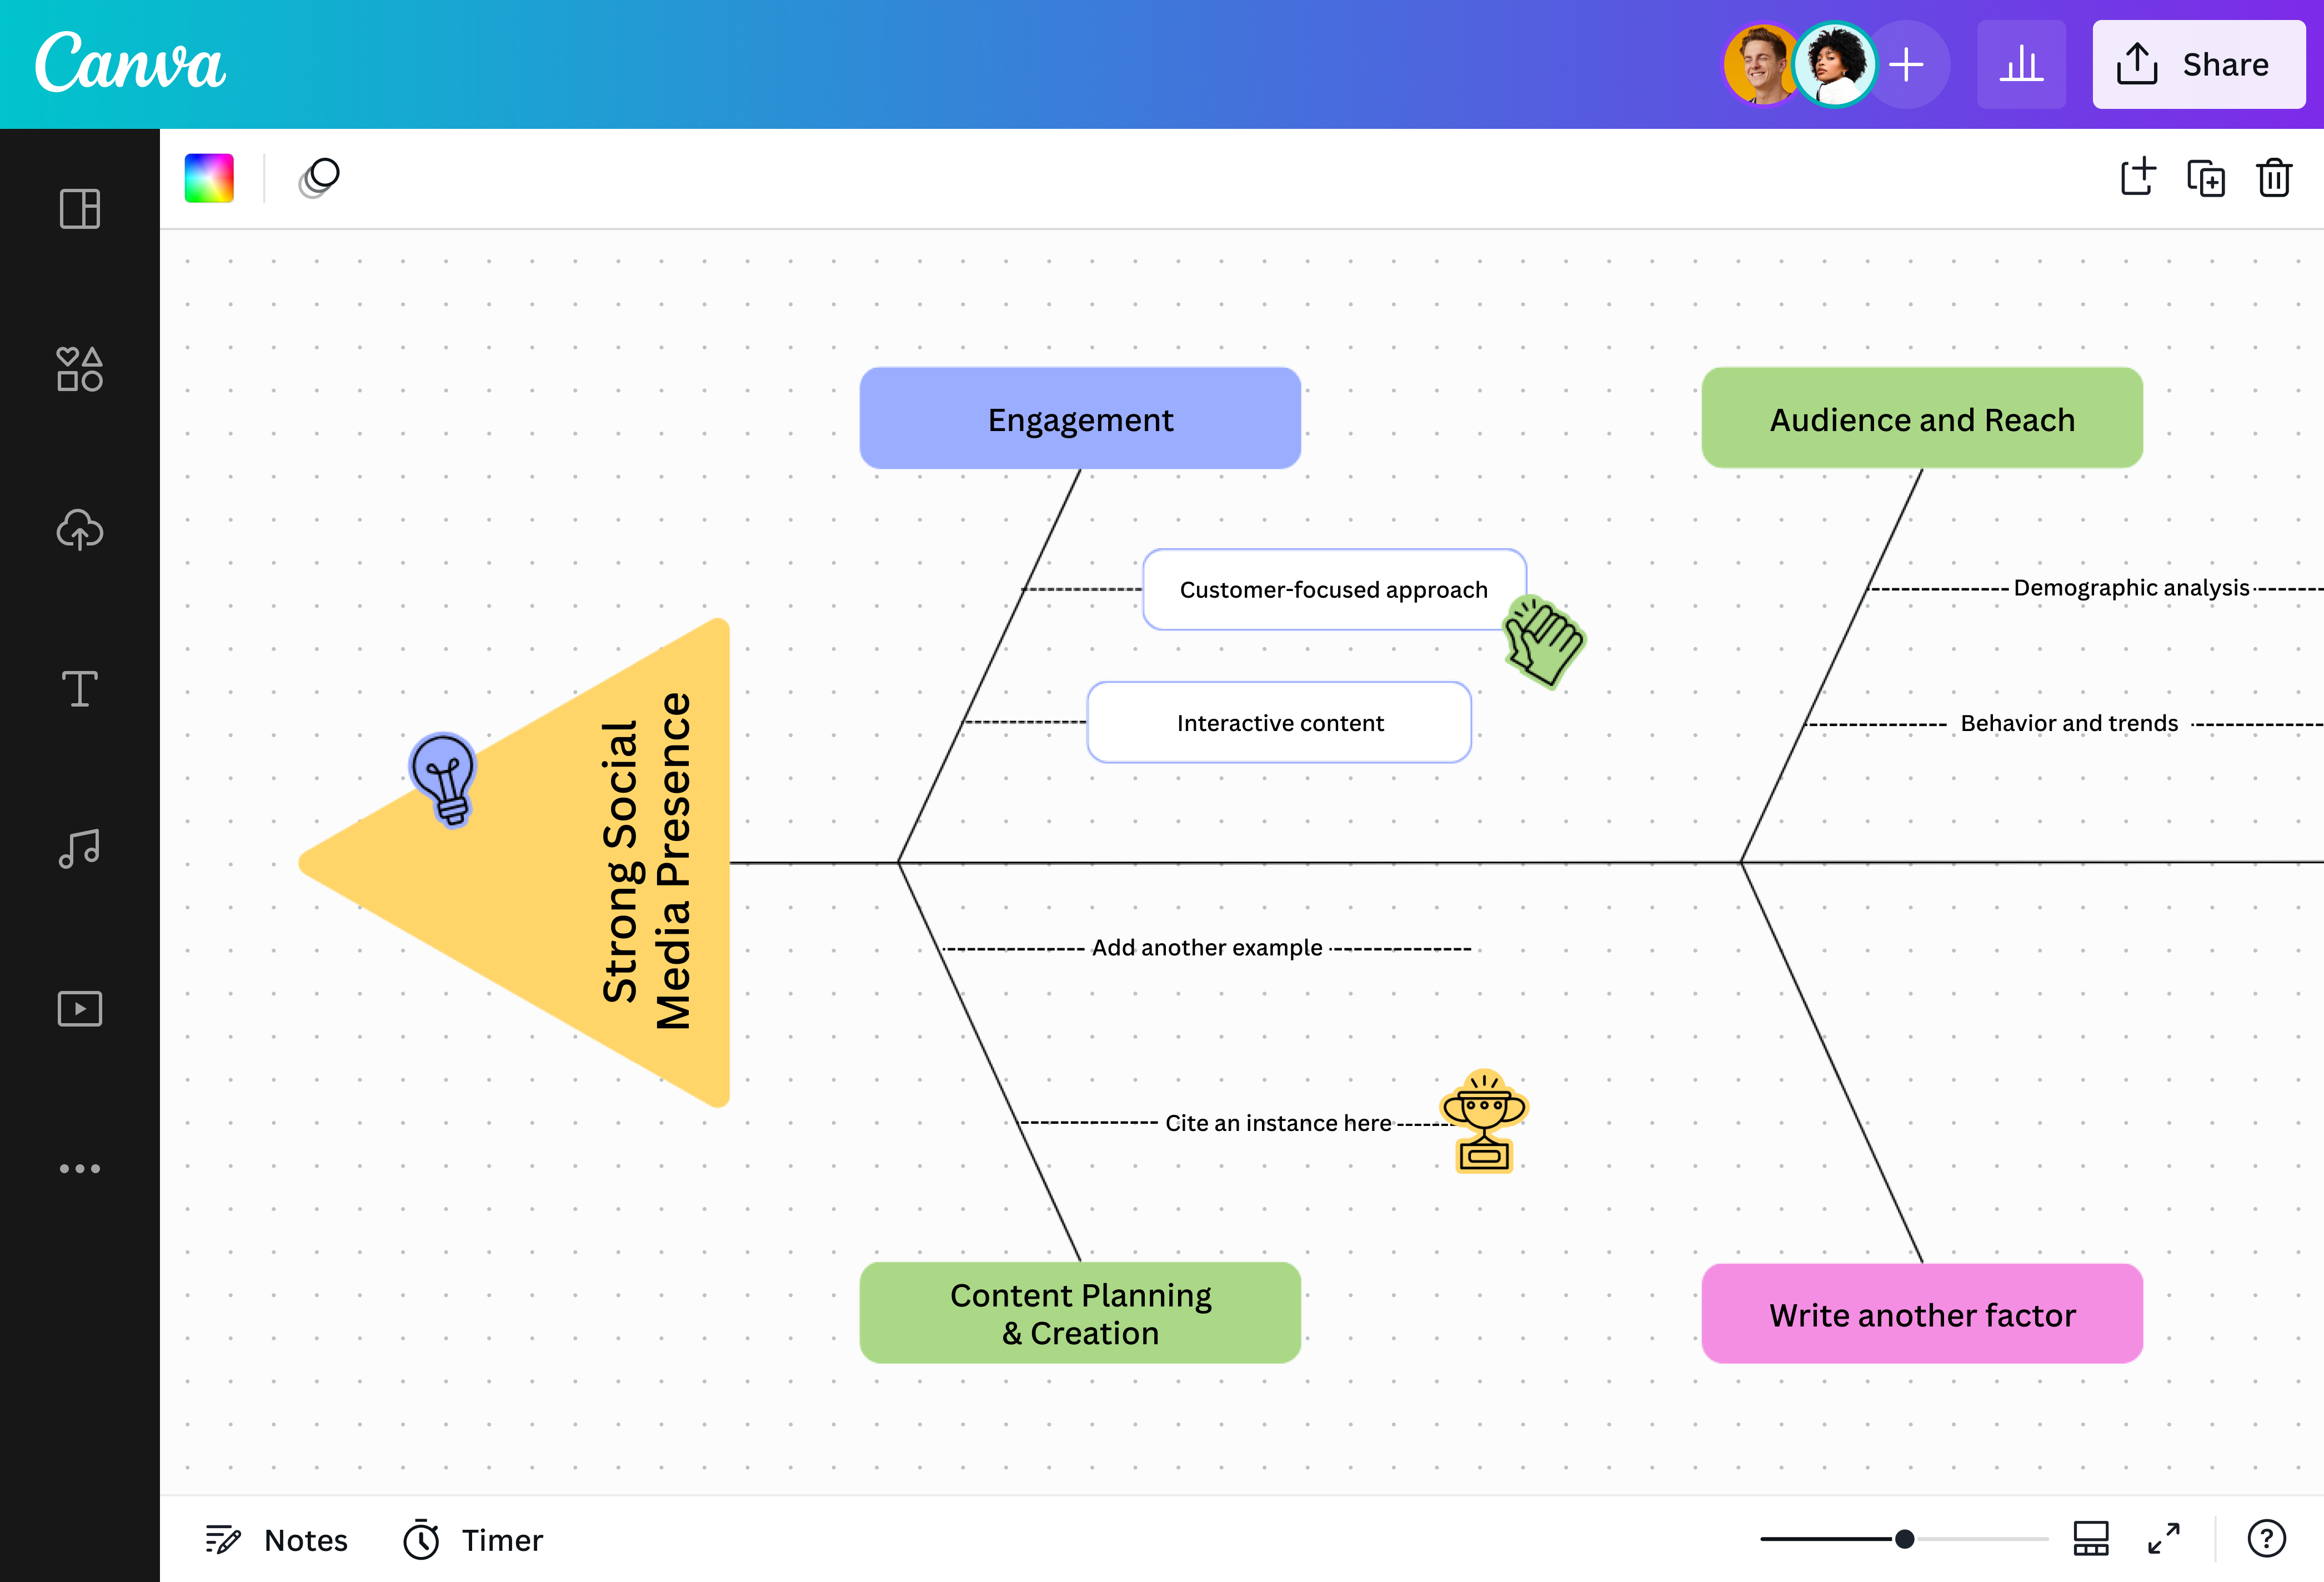
What is a fishbone diagram?
A fishbone diagram, also known as an Ishikawa diagram or cause-and-effect analysis, is a visualization tool used to identify all possible factors contributing to an issue or defect. Fishbone diagrams are used not only to solve existing problems within an organization, but to map out and mitigate potential risks as well.
Why use fishbone diagrams?

In the root-cause analysis approach, proponents believe that to solve a problem, you need to address the underlying issues first. Ishikawa diagrams are great for visualizing that very process, with a structure that encourages looking at a problem from multiple angles.
From corporate to medical settings, fishbone diagrams have a sea of applications. For example, in product development, fishbone diagrams are useful for identifying gaps in the current market, while in the medical setting, they can be used to prevent bottlenecks and inefficient processes.
Start fishing for ideas in a few clicks

Creating fishbone diagrams can not only be fiddly but time-consuming as well. But with Canva Whiteboards, you can complete one in just minutes. Select a free template from our library and use our straightforward drag-and-drop editor to start customizing. No design experience? Get a helping hand from Canva Assistant.
Enjoy a treasure trove of tools and elements

Make your fishbone diagram completely your own with our expansive library of fonts, automatic connectors, customizable shapes, graphics, stickers, photos, videos, charts, frames, and other tools. Add a table(opens in a new tab or window) to summarize all points raised in your diagram and assign point persons to get to the root of each underlying cause.
Collaborate easily with your crew

Why work alone when you can invite your team aboard? Encourage collaboration with tools like sticky notes, comments, timers, and colored cursors that help keep track of who’s working on what. And if you’re presenting a diagram and a teammate wants to add their insights, you can easily transform your presentation(opens in a new tab or window) into a whiteboard with just one click.
Cast your net as wide as you like

Don’t let space — or lack thereof — affect the quality of your work. With Canva Whiteboards, everyone has unlimited space to process their thoughts, expand the diagram, and even sketch out their ideas using Draw(opens in a new tab or window), our online drawing tool.
Start inspired with a fishbone diagram template


Assem A
Frequently Asked Questions
- A fishbone diagram consists of a “head”, where the main problem goes, and several “bones”, where you note down the causes that contribute to the problem. Sometimes, it is necessary to write broad headings atop each bone and add more specific subheadings and details underneath or between each bone.
In root-cause analysis, the “5 whys” technique involves repeating the question “why” five times. This technique helps break down the causes and sub-causes of a problem until you reach a clear and actionable root. Here is an example of a 5 whys analysis in a warehouse management setting:
Problem: Customers are complaining about delivery delays.
Why? Because the warehouse is taking more time than usual to ship out orders.
Why? Because the staff have to reprint the product labels.
Why? Because of a misprint issue on the last batch of labels.
Why? Because a staffer input the wrong information.
Why? Because of an outdated option listed on the website.
The root cause: the outdated information on the website.- Fishbone diagrams can be used to encourage students to investigate problems from multiple points of view and organize seemingly abstract concepts into categories. Fishbone diagrams can also be used to kick off discussions which, in turn, allow students to practice their analytical and critical thinking skills.
- To make a fishbone diagram online, simply log into Canva and browse our library for dozens of free fishbone diagram templates. Select the template you like and start customizing it with our easy-to-use drag-and-drop editor. Once you’re done, share your diagram via email, download it as a JPG, PNG, or PDF file, or print it via Canva Print.