- Genograms
Free online genograms
Create a genogram online
Go beyond the traditional family tree and analyze detailed relationships between family members. Our free genogram maker helps you track hereditary patterns and psychological factors that affect relationships. Collaborate with your team and create a genogram using free templates, an extensive visual library, and a suite of collaboration tools on Canva Whiteboards.
Infinite space made for unlimited ideas
Professionally designed templates to fast-track your workflow
Share and ideate with anyone, anytime, on any device
Run a workshop with whiteboard elements, sticky notes, and a timer
Embed your genogram in Docs, presentations, and more easily
Easy online whiteboard tools and data visualization
How to make a genogram

What is a genogram?
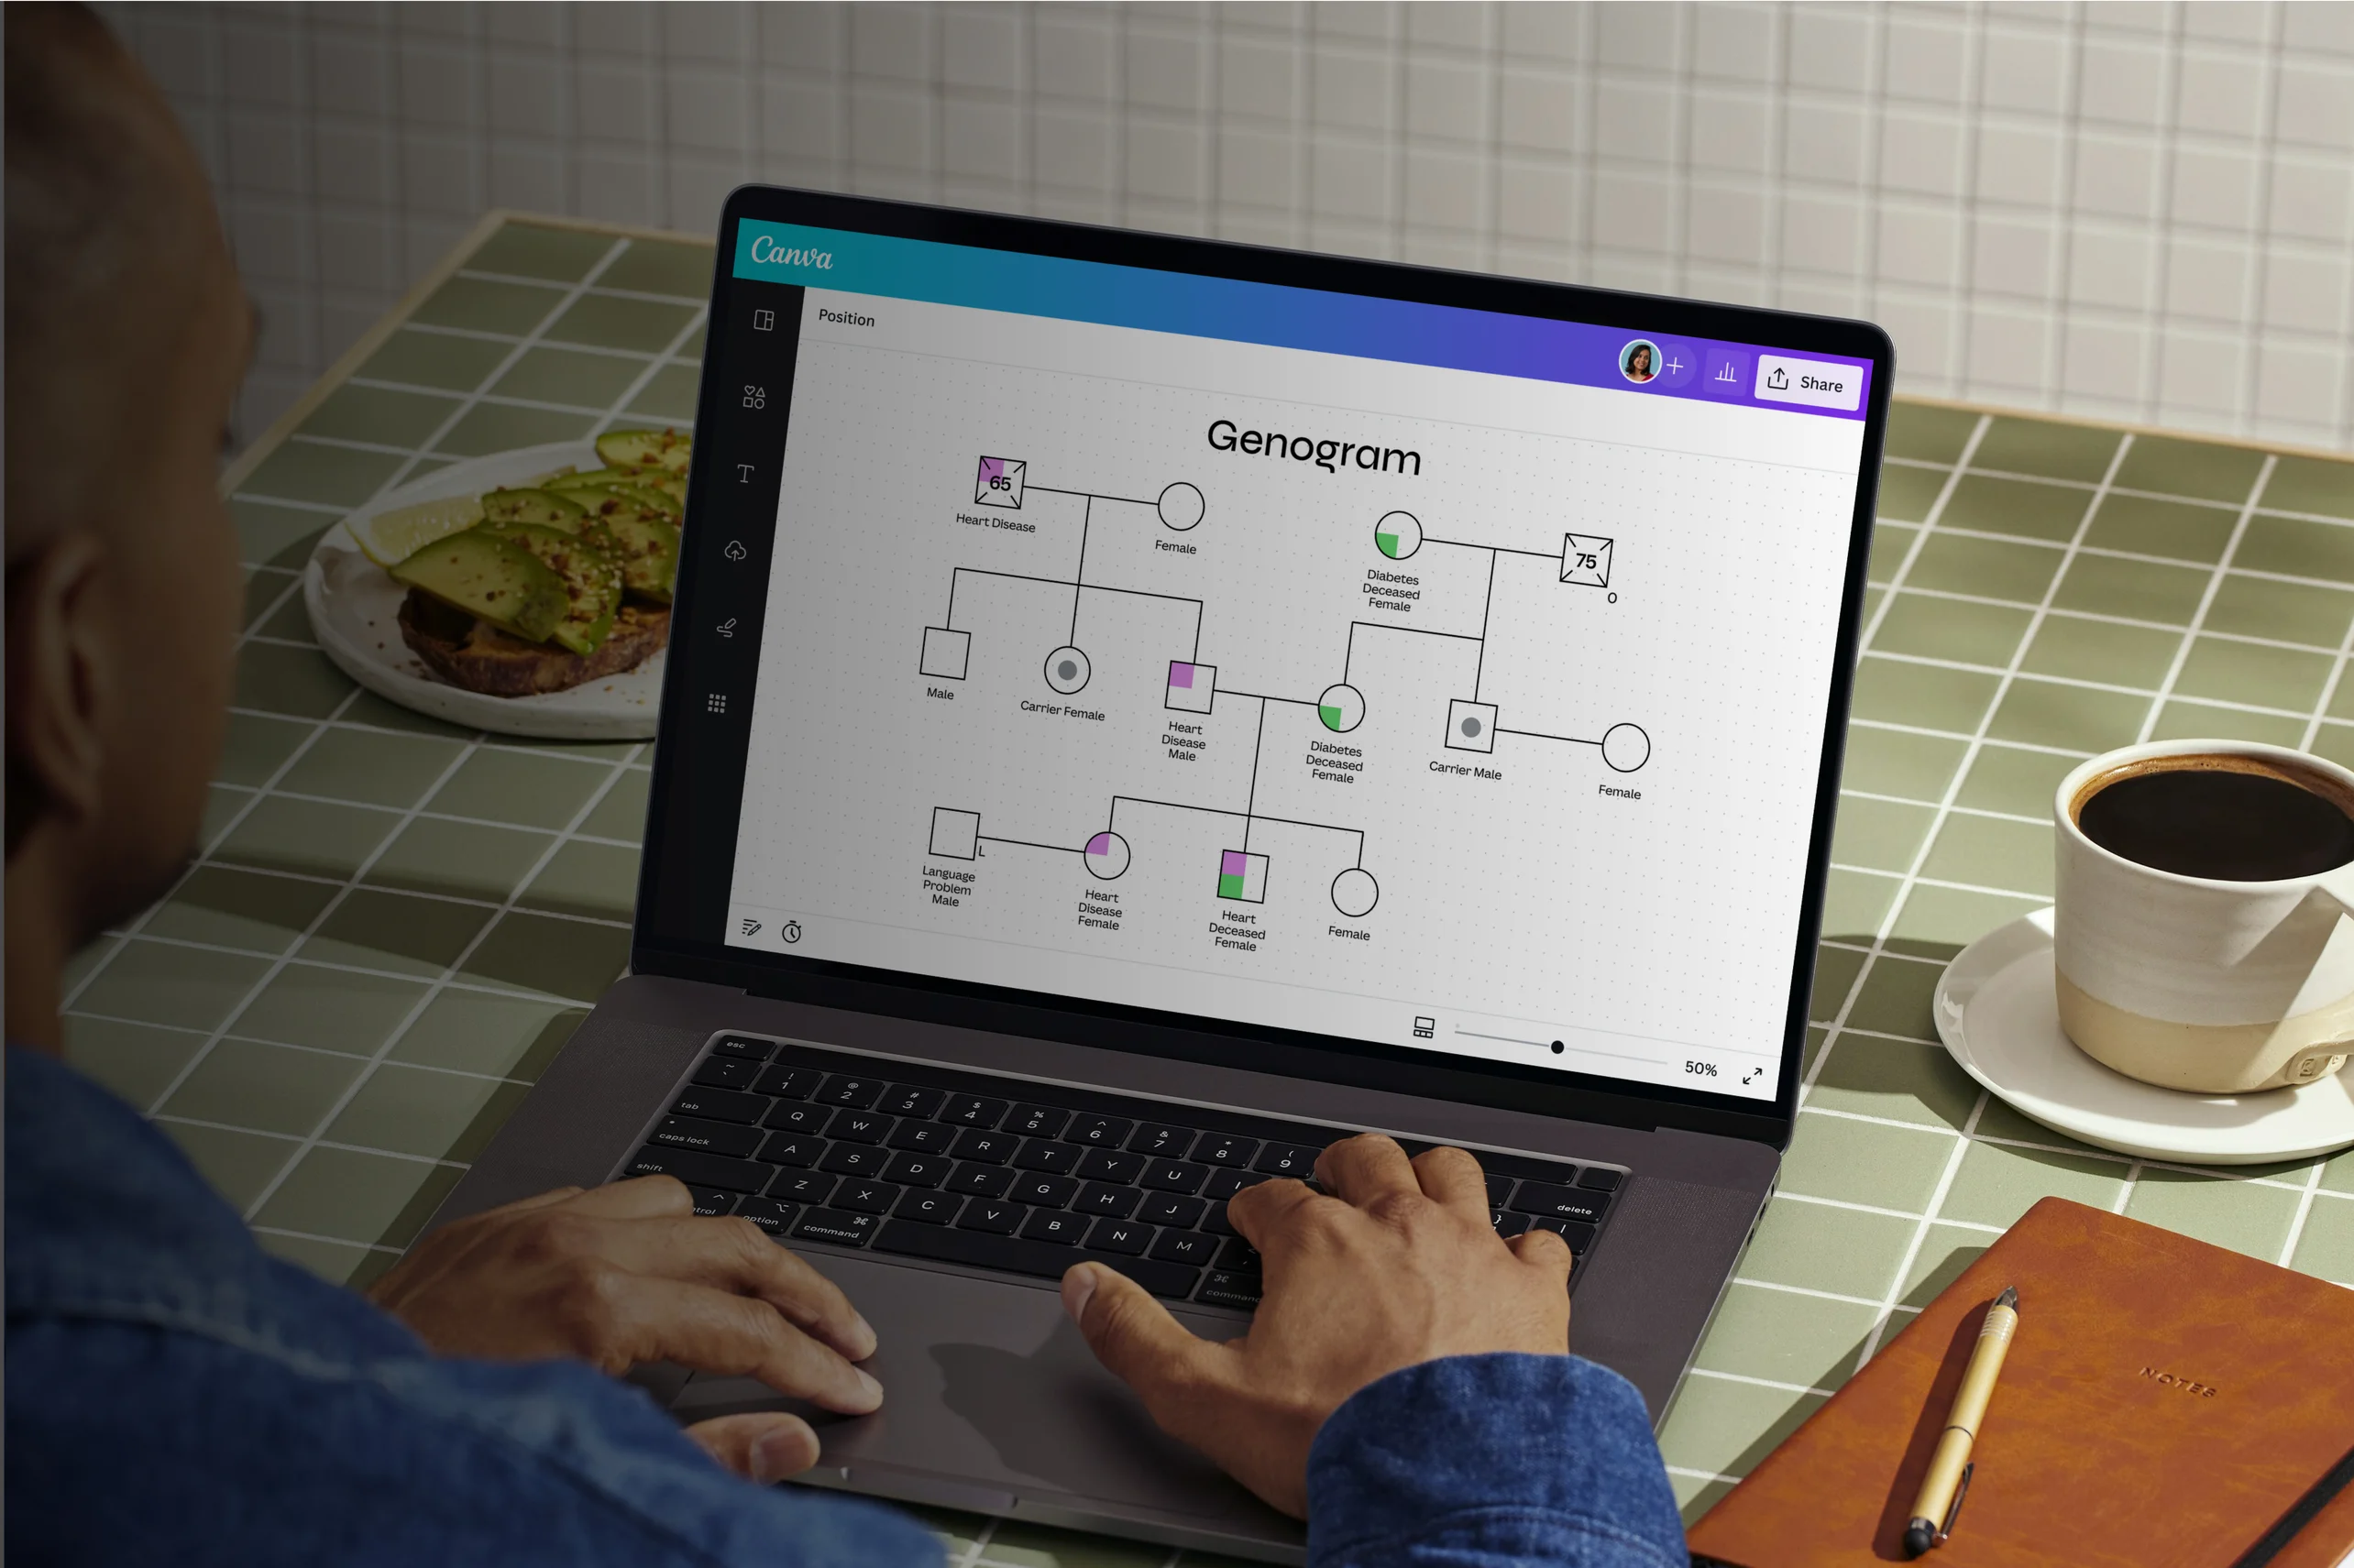
A genogram is a visual representation of a person’s family tree, history, and relationships. It provides detailed information on the dynamics between family members, as well as their medical histories. Genograms are actively used in various fields, such as medicine, social work, psychology, genealogy, and education.
Why use genograms?

Genograms provide insights into a subject's family dynamics, emotional bonds, key people, and relationships. They also help trace patterns in family history and analyze their impact on relationships.
Doctors use genograms to quickly obtain information about a patient's family history of disease. Therapists use them to identify relationship patterns that influence their client's state of mind. Ultimately, genograms help medical professionals prescribe effective treatments or therapies.
Dive deeper into your family history

On Canva Whiteboards, you have infinite space to explore your family’s history and relationships. Trace health history and navigate emotional connections among family members with our free genogram maker. Choose from our ready-made templates to create a genogram that’s both stunning and informative — no design background is needed.
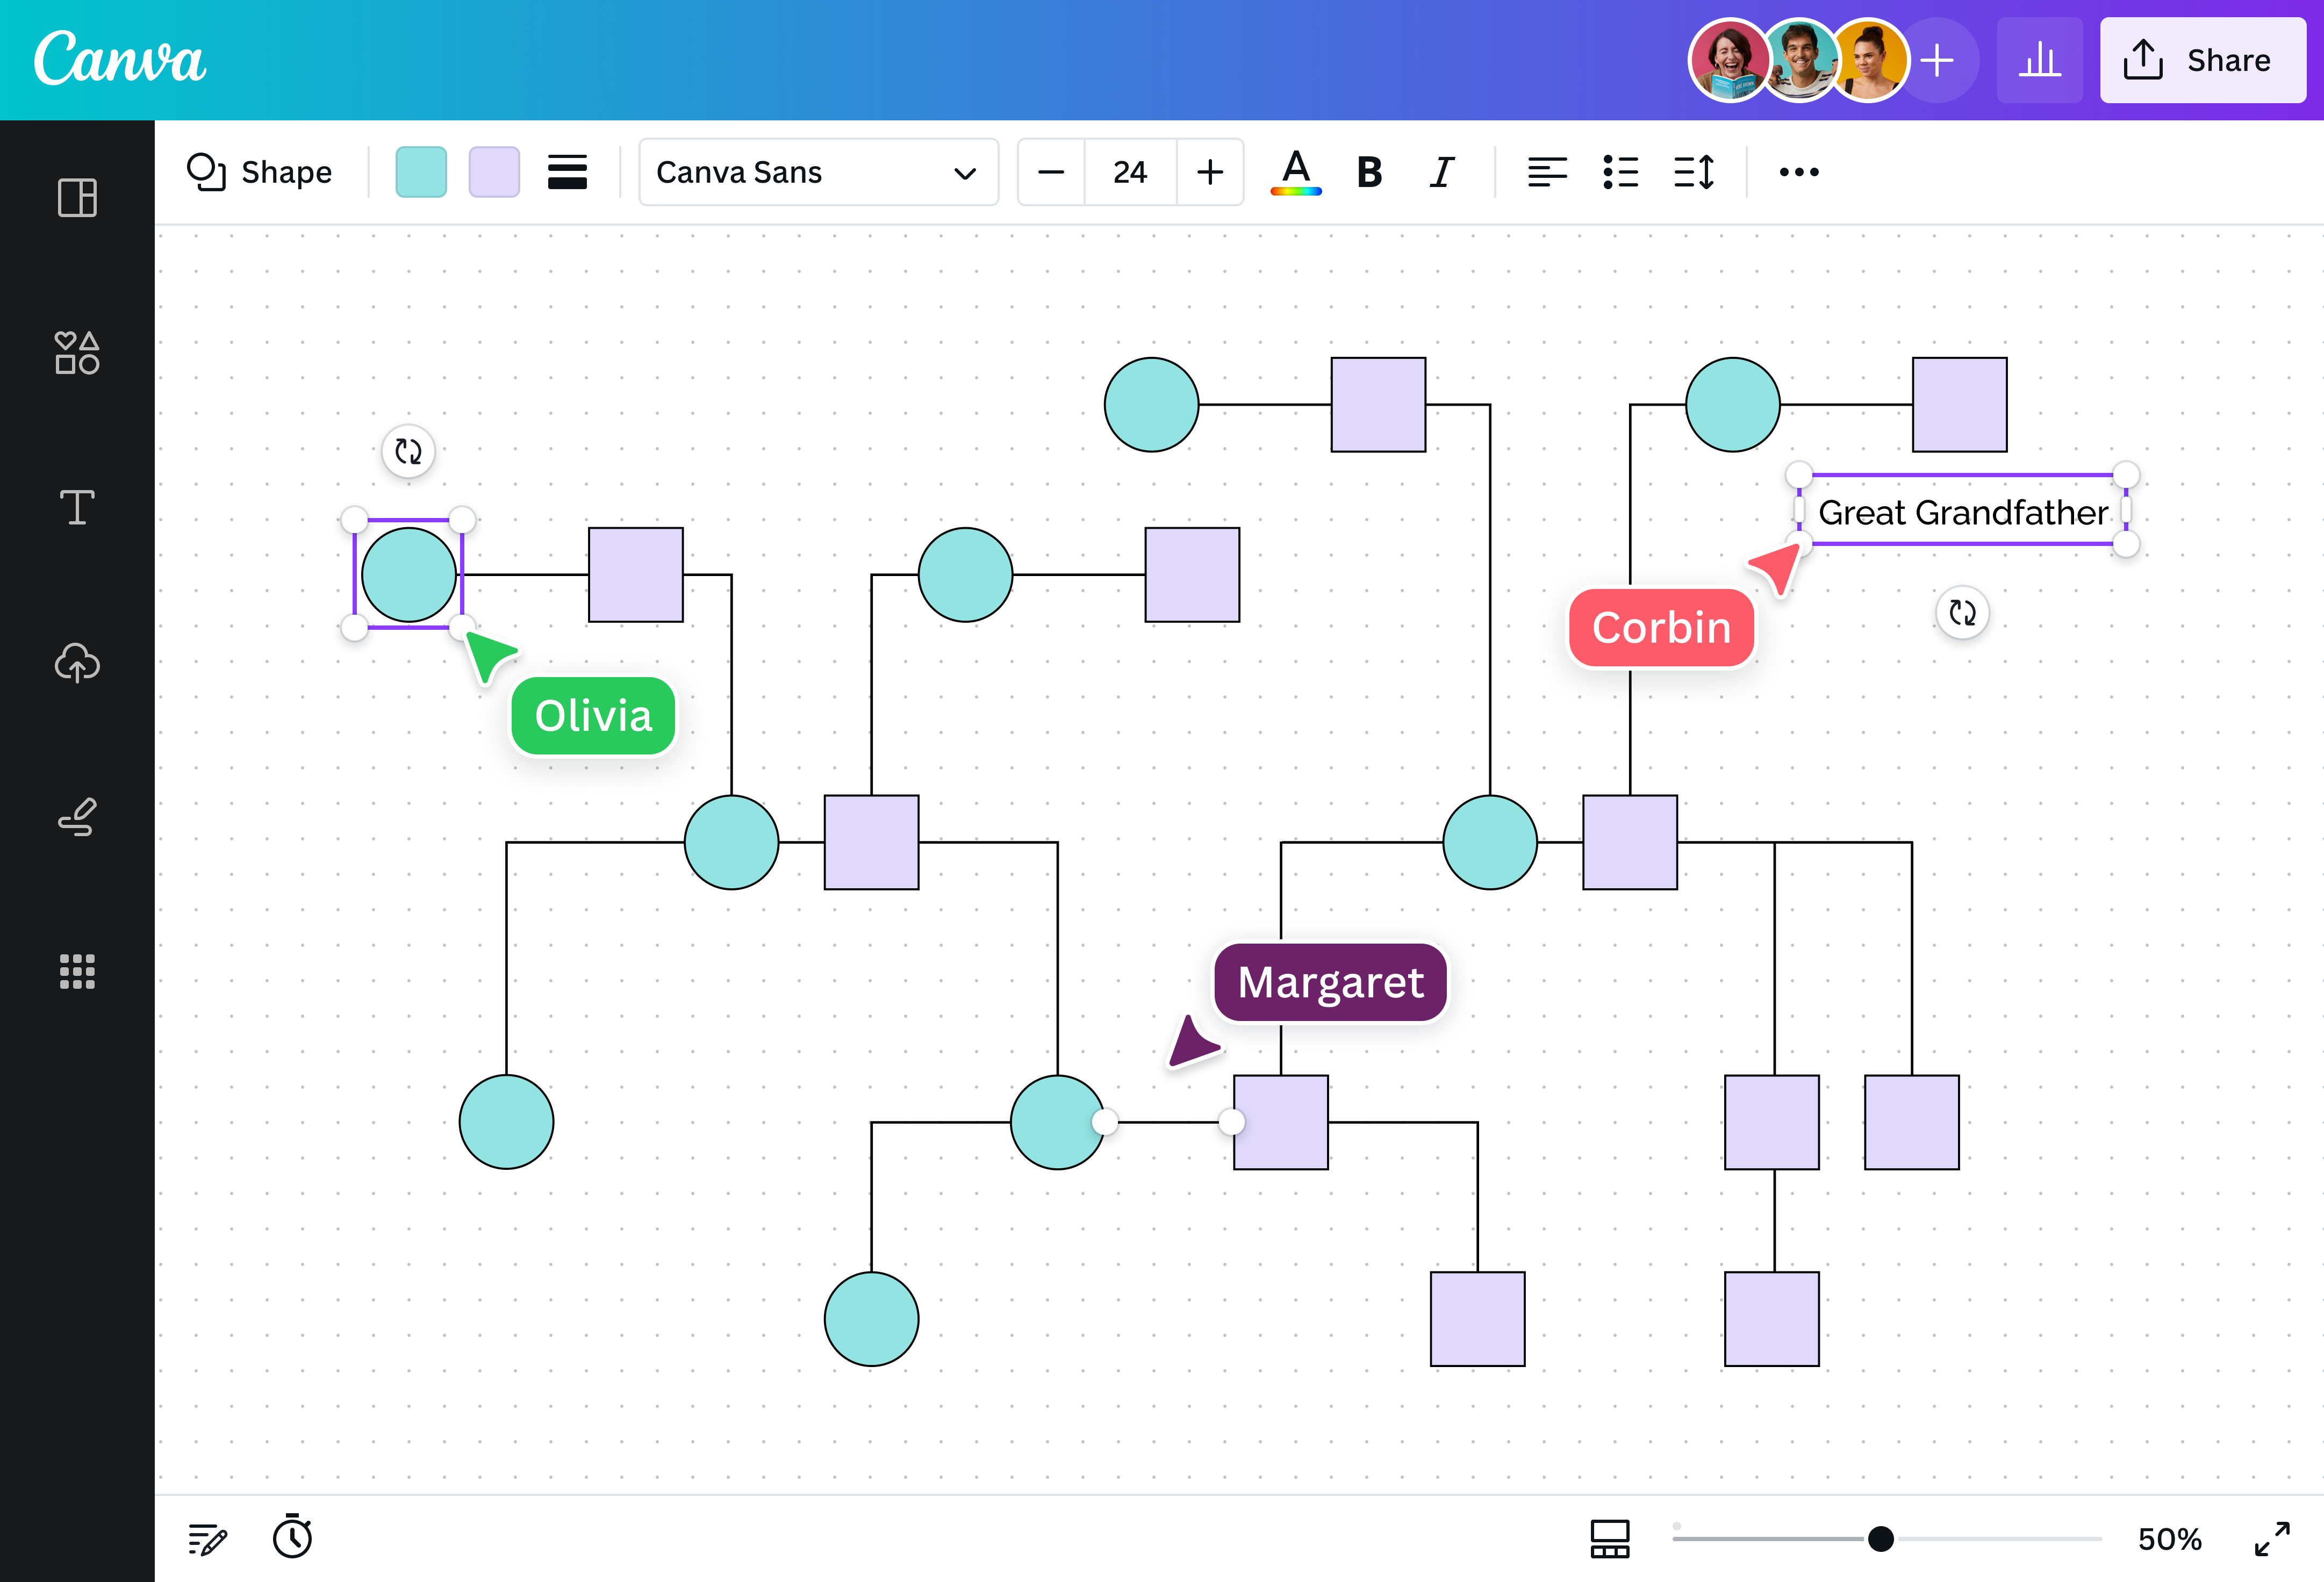
Visualize patterns with design elements

Genograms use lines and symbols to effectively map out family history and relationships. Browse the Elements tab, which houses lines, shapes, and more, to find your preferred style. Then, drag and drop the elements to where they need to be on your genogram. You can also sketch them freehand using Draw(opens in a new tab or window) and let Shape Assist modify your shapes and lines to perfection.
Display data with style

While analyzing family dynamics and history is a serious matter, you can still create a genogram that balances substance with style. Choose fonts and color palettes that match the theme of your family. You can also add graphics and stickers, or apply textured backgrounds on your canvas to make mapping out relationships more engaging.
Invite the whole family

Ensure the accuracy of your genogram by inviting your family to collaborate on your design. Easily share access with your relatives and watch them edit your template, leave comments, or add sticky notes(opens in a new tab or window). Plus, you can always go back to your online whiteboard anytime, anywhere, to regularly update your family’s evolving relationships.
Start inspired with a genogram template


Assem A
Frequently Asked Questions
Genograms come in different types, each with its own purpose and benefits. Here are some of them:
- Family genogram: A family genogram displays up to three generations of a family. It’s used to track a person’s ethnicity or ancestry.
- Emotional genogram: An emotional genogram provides insights into whether a relationship is close, distant, conflicted, or even abusive between family members.
- Relationship genogram: A relationship genogram determines how individuals are related to one another. It covers marriages, committed or casual relationships, divorces, separations, and cohabitations.
- Medical genogram: A medical genogram is handy when understanding a family’s medical history. It’s used for tracing diseases in the family and identifying carriers of certain genes.
- Family genogram: A family genogram displays up to three generations of a family. It’s used to track a person’s ethnicity or ancestry.
Genograms use a variety of symbols and colors to represent family members and relationships. Here are some examples:
- Shapes: A square represents male, while a circle represents female. A square with a triangle inside represents gay, while a circle with a triangle inside represents lesbian. A square within a circle represents a transgender woman, while a circle within a square represents a transgender man. Triangles signify pregnancy, while diamonds represent pets. A cross through any shape means death.
- Colors: A red quarter on the top left of a shape means heart diseases, while a green quarter on the bottom left means diabetes.
- Lines: A solid black line means marriage, while a dotted line means engagement. Two strokes through a solid line signifies divorce, while a cross through a solid line means widowed.
- Shapes: A square represents male, while a circle represents female. A square with a triangle inside represents gay, while a circle with a triangle inside represents lesbian. A square within a circle represents a transgender woman, while a circle within a square represents a transgender man. Triangles signify pregnancy, while diamonds represent pets. A cross through any shape means death.
- While genograms and family trees share similar structures, they contain different information. A genogram covers the relationships and histories among family members. A family tree only depicts lineage and ancestry.