- Cycle Diagram

Free Online Cycle Diagram Maker
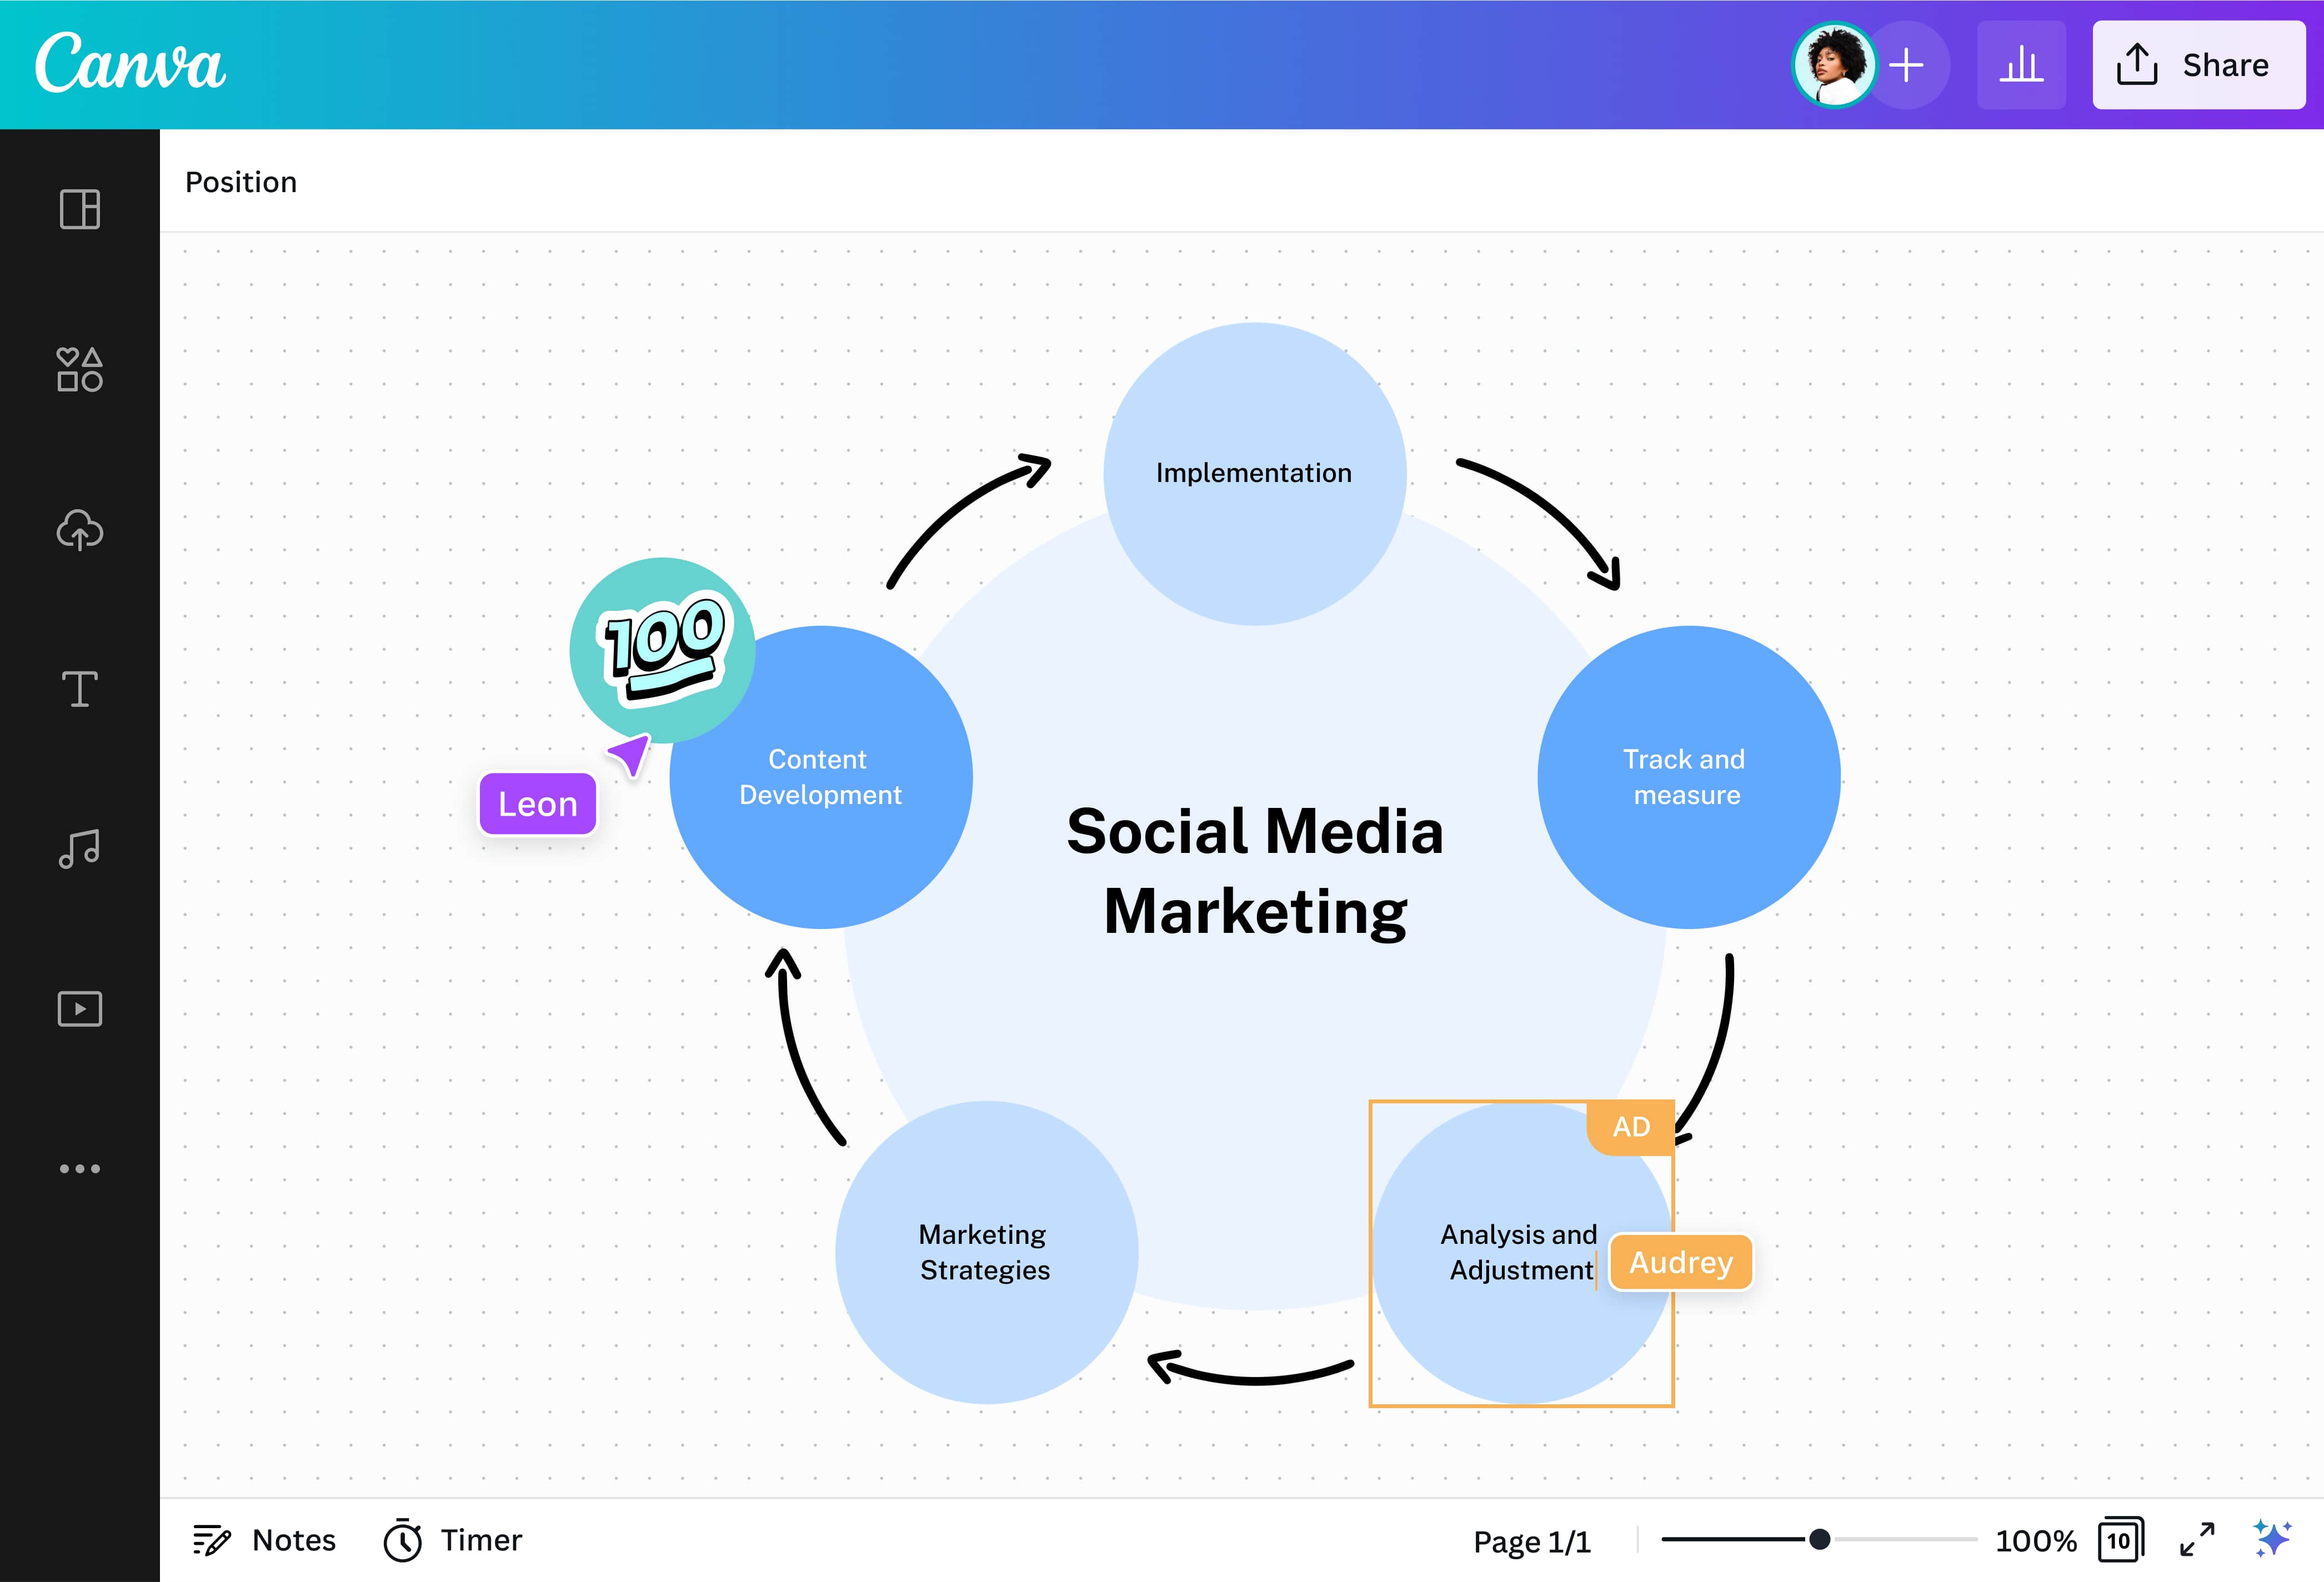
Create a cycle diagram online
Cycle diagrams are used for all sorts of processes and series of events. You can use one to show the flow of money in an economy, the way resources move through a production process, or the life cycle of an idea. The key to a cycle diagram is that there is no beginning or end, one step follows another repeatedly.
More than 20 professional types of graphs to choose from
Professionally designed templates to fast-track your workflow
Data visualization made easy – no complicated software to learn
Publish, share, or download your high-resolution graph
Embed your cycle diagram in presentations, reports, and more with no fuss
Easy drag-and-drop tools, made with the non-designer in mind
How to create a cycle diagram

What is a cycle diagram?
A cycle diagram (sometimes called a cycle chart) is a visual representation of a repeating process or continuous flow state. It is usually represented with a circular graph. You can use a cycle diagram to showcase a series of events or steps that occurs chronologically and are repeated over time, where the beginning and end blend into each other.
Why use cycle diagrams?

Different industries use cycle diagrams differently. For example, in education, teachers use cycle diagrams to explain scientific processes like the water cycle and Kreb’s cycle. In business management, leadership teams may use cycle diagrams to showcase a new strategy and decision-making policies.
Visualize cyclical processes with ease

Express your ideas with cycle diagrams easily using Canva’s built-in drawing and whiteboard tools and professionally designed templates. Use Draw(opens in a new tab or window), our freehand drawing app, to set the grounds for your cycle diagram. Add shapes, lines, arrows, line connectors to match your chart’s purpose. Complete your cycle chart with text, colors, and graphics to clearly show how one step flows to the next.
All the cycle diagram maker features you need

Content is at your fingertips when you use our free cycle diagram maker(opens in a new tab or window). Access our entire content library of graphics, fonts, backgrounds, layouts, colors, and more to realize your cycle chart vision. You can even illustrate a step within your process using images, GIFs, videos, or turn a prompt to an image using our Text to Image(opens in a new tab or window) app.
Collaboration and inspiration anytime, anywhere

Work wherever inspiration strikes. Access Canva from any device. Our cycle diagram maker shows colorful, real-time mouse cursors, letting you know what a collaborator is doing and where they are on the design. Level up your collabs using the timer, add emoji reactions and tags, or leave comments. Workshop ideas and present the final cycle diagram straight from the dashboard.
More space for flow and continuity

Cycle diagrams are all about movement. They illustrate how stages move from one to the next. Let your canvas flow infinitely by expanding it to a whiteboard. With our unlimited design canvas, automatic connectors, and Shape Assist, you can create, brainstorm, and iterate with ease and confidence—giving you the freedom to unleash all your ideas.

Assem A
Frequently Asked Questions
- It’s best to use a cycle diagram for the following scenarios or use cases:
- To illustrate a series of steps or sequences that keeps on repeating.
- To explain each phase or step in a cyclical process.
- To further define and explain the sub-steps in each phase or sequence.
- A cycle diagram is a visual representation of any repeating process or continuous flow state. In the same vein, a lifecycle diagram is a sub-type of a cycle diagram. Life cycle diagrams just focus on the sequence of growth of different organisms, typically the cycle from being an embryo to adulthood.
- You won’t need to download Canva to start designing. Simply head on over to www.canva.com, create an account, and log in. If you want to design on the go, download our free iPhone, iPad, or Android apps from the App Store or Google Play.
- From time to time, you might need to update a text or step in your cycle diagram. With Canva, you can edit and save your designs as many times as you like. Every time you create a new cycle, it will appear in the "My Designs" section of your Canva homepage.
- Once you're finished designing your cycle diagram, you can share your design straight from Canva or download it for printing. To share your design, click on the Share button, then choose whether to email your design to specific people, post your finished design via social media, or even embed it on your blog or website. To download your design, click on the Download button, then choose the file type (JPEG, PNG, PDF - Standard, or PDF - Print).