- Pictograms

Pictograms
Pictogram maker features
Find meaningful icons or images to represent your data using Canva’s free pictogram maker. Select any template for your infographic, poster, presentation, or more, and visualize your data using pictogram examples you can customize. Apply your survey results or goal progress, and add more visual context through our rich content library and collaborative editing features.
More than 20 professional types of graphs to choose from
Professionally designed templates to fast-track your workflow
Data visualization made easy – no complicated software to learn
Publish, share or download your high-resolution graph
Embed your pictogram in presentations, reports, and more with no fuss
Easy drag-and-drop tools, made with the non-designer in mind
How to create a pictogram

What is a pictogram?
A pictogram or pictograph is a simple and popular data visualization tool for ratings, progress, scores, and survey results. It uses repeated icons, images, or symbols to represent simple data on a certain topic. A pictogram chart is often arranged in a grid or line suggesting units of tens, hundreds, or thousands with the actual data shaded in a contrasting color. Pictograms usually appear in infographics, reports, presentations, or video ads.
Numbers you can see and understand

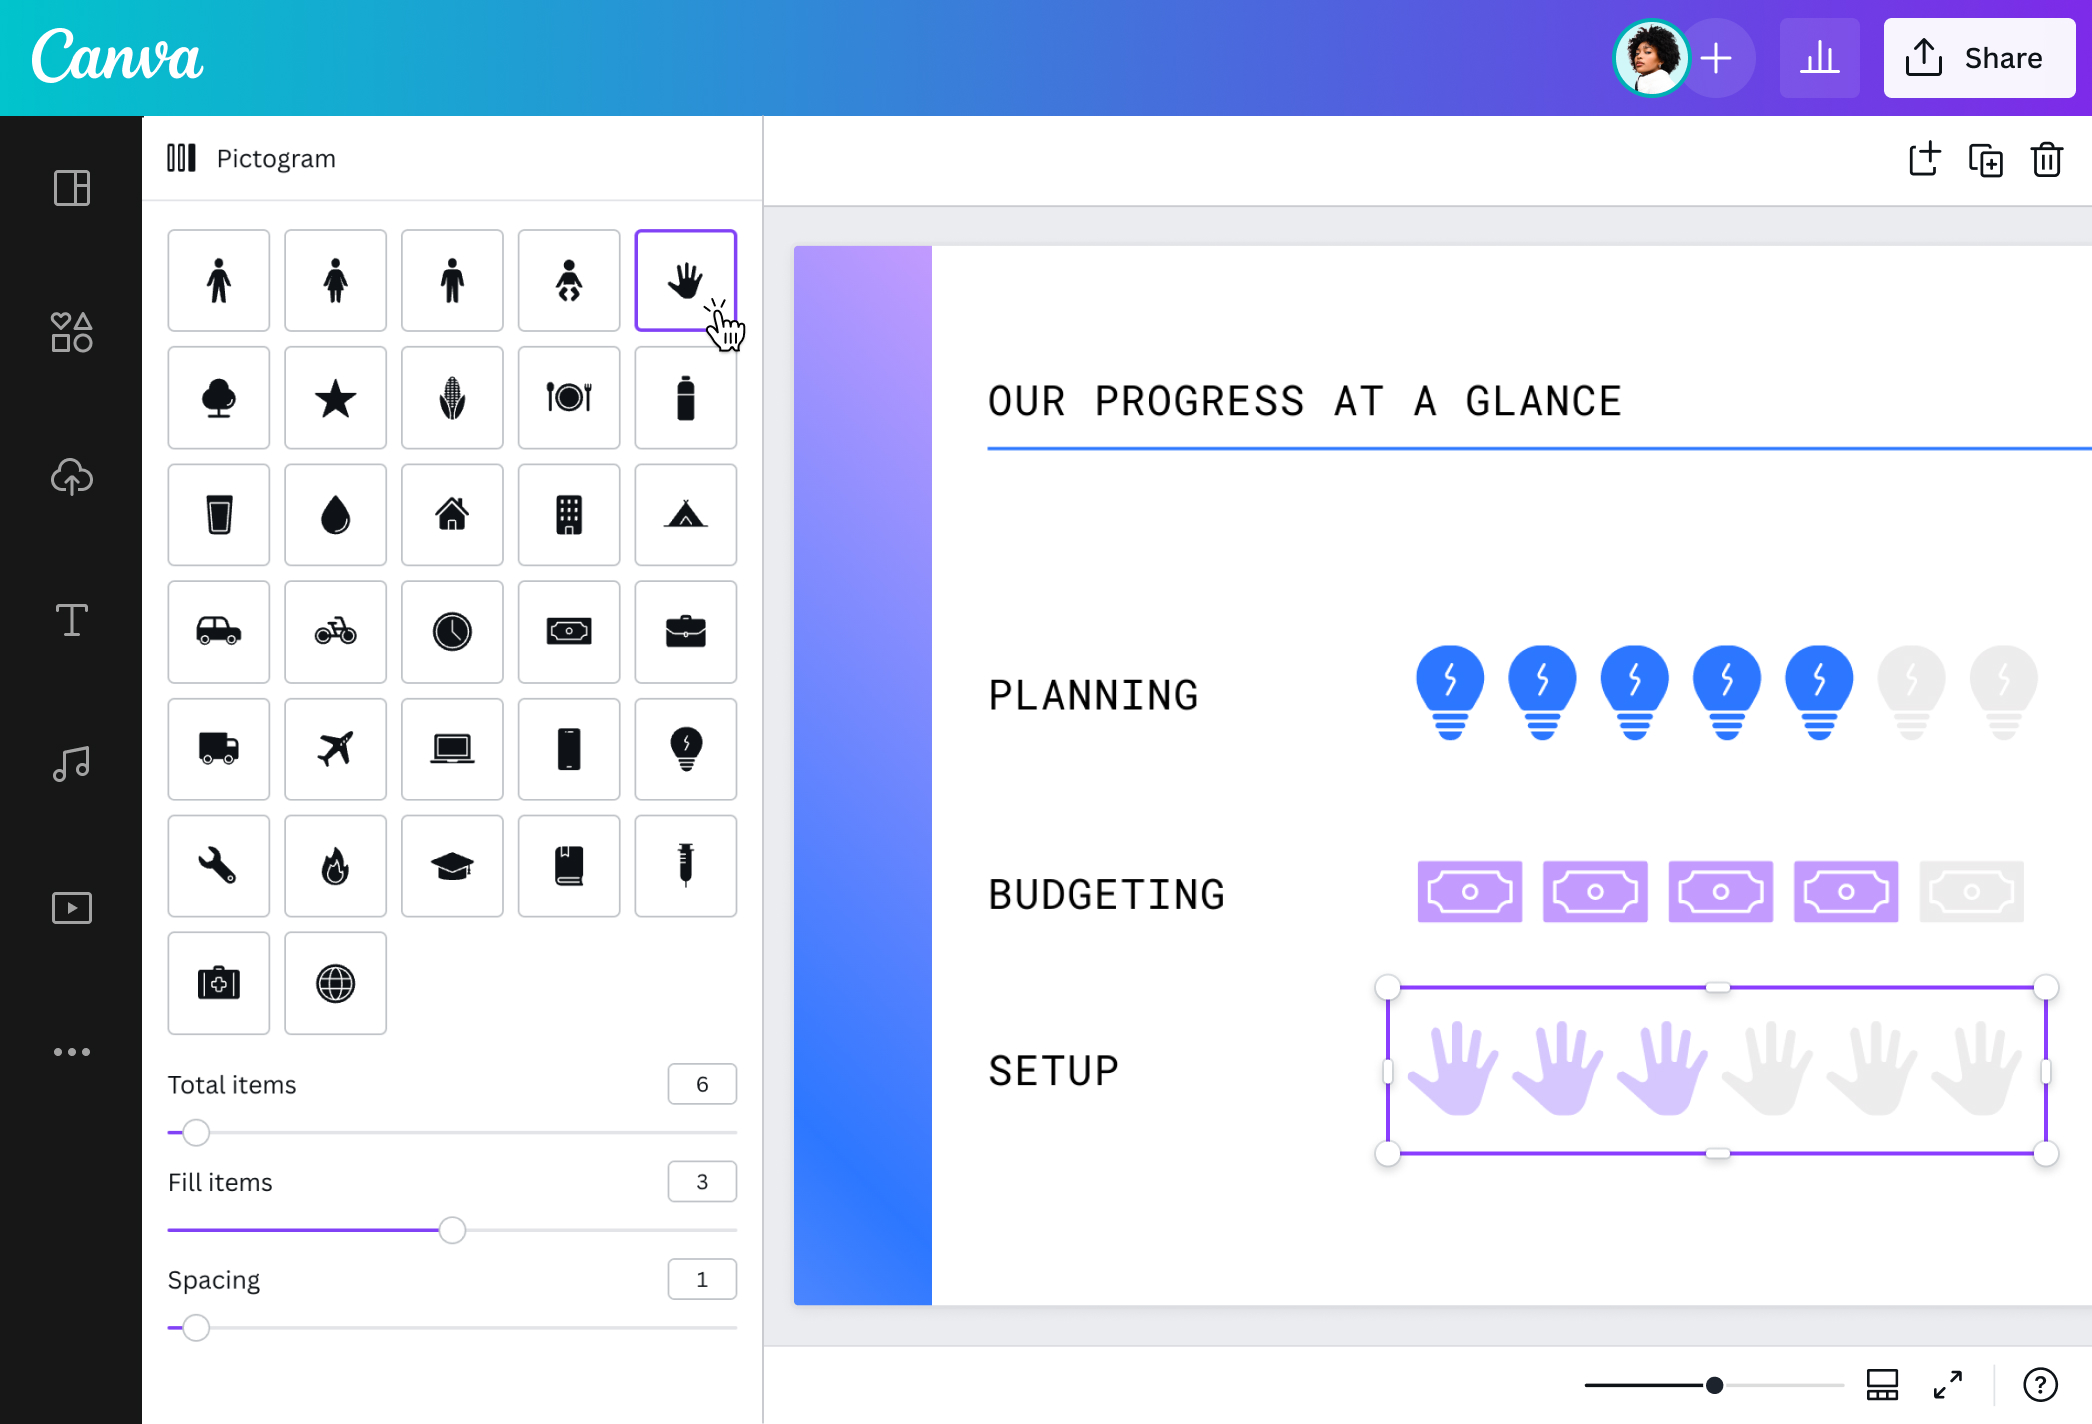
Big numbers don’t need equally heavy visuals for your readers’ eyes to feast on. Get the same impact of important statistical information or progress with pictograms. Visualize any overwhelming data with fun yet sensible pictogram symbols you can use from Canva’s free pictogram maker. Simply set your fill and total items using the sliders to show a fraction or percentage in your data. It can be for your survey on who loves dogs more than cats or the progress of your class in the last math test.
Interpret data with pictogram symbols

Pictograms work with repeated icons or images to represent data. Explore many options from our pictogram maker and make those numbers meaningful with relevant symbols. From data on people and food to gadgets, places, or transportation, there’s a relevant icon for you. You can also search our library for more elements like photos, vectors, and graphics to support your infographics.
Custom colors and formatting

Use your pictograms to strike a balance between words and numbers. Personalize them to fit the theme and style of your infographics or presentations. Position it nicely between chunks of text with beautiful fonts from our library. Apply appropriate spacing on each icon to maximize your layout. You can emphasize the magnitude of your data better with the right color scheme. Find a striking mix from our ready-made palettes. When you need a dynamic flair for your data slide, animate it with your presentation.
Polish with your team

Collaborate with your team to produce a foolproof infographic, presentation, or report for your project or class. Review your pictogram chart with them by sharing a design link to access and edit your work. Do things simultaneously—leave comments, apply changes, and edit anytime, anywhere across desktops and mobile devices. Then, publish and share your data with a printed infographic or share your pictograms online as high-quality images.
Pictogram templates


Anon
Frequently Asked Questions
- Pictographs bank on easy data visualization. Start by gathering your data and interpreting them appropriately. Use our pictograph maker to visualize it with no hassle. Stick to a clean yet striking design with simple and recognizable icons or symbols. Improve readability by getting your color scheme and formatting right. Go for the lighter shade of your fill item color for your total items. Then, adjust the spacing and size of your pictograph symbols.
- A pictogram or pictograph is a chart type in math or statistics used to contrast data represented by symbols, icons, or images. A fraction is shaded to represent a fraction of the total number of respondents or population and show a consensus.
- Pictograms can be traced back to ancient origins from cave paintings in 30,000 BC and evolved into logo-graphic writing systems adapted by early civilizations in Ancient Sumeria, Egypt, and China. It has been used around the world since 9,000 BC.
- Use a pictogram to visualize data in your infographics, presentations, or reports—easily present impactful statistical information sans overwhelming numbers or digits. Choose any icon from our free pictogram maker and input your data according to the total and items you want to fill or shade.