- Diagrams

Free online diagrams
Create a diagram online
Diagrams come in all shapes and sizes—and Canva Whiteboards lets you design them all. From simple Venn diagrams to complex process flows, this diagram maker offers endless customization options and handy collaboration tools, so you can seamlessly design diagrams with your team.
Infinite space made for unlimited ideas
Professionally designed templates to fast-track your workflow
Share and ideate with anyone, anytime, on any device
Run a workshop with whiteboard elements, sticky notes, and a timer
Embed your diagram in Docs, presentations, and more easily
Easy online whiteboard tools and data visualization
How to make a diagram

What is a diagram?
Diagrams are simplified illustrations that explain ideas, structures, and processes. They also show how parts work together and how things relate. Diagrams are diverse; some compare and contrast, some show relationships, while others map out cause and consequence. But no matter the type of diagram, one thing remains the same: diagramming makes complex things easy to understand.
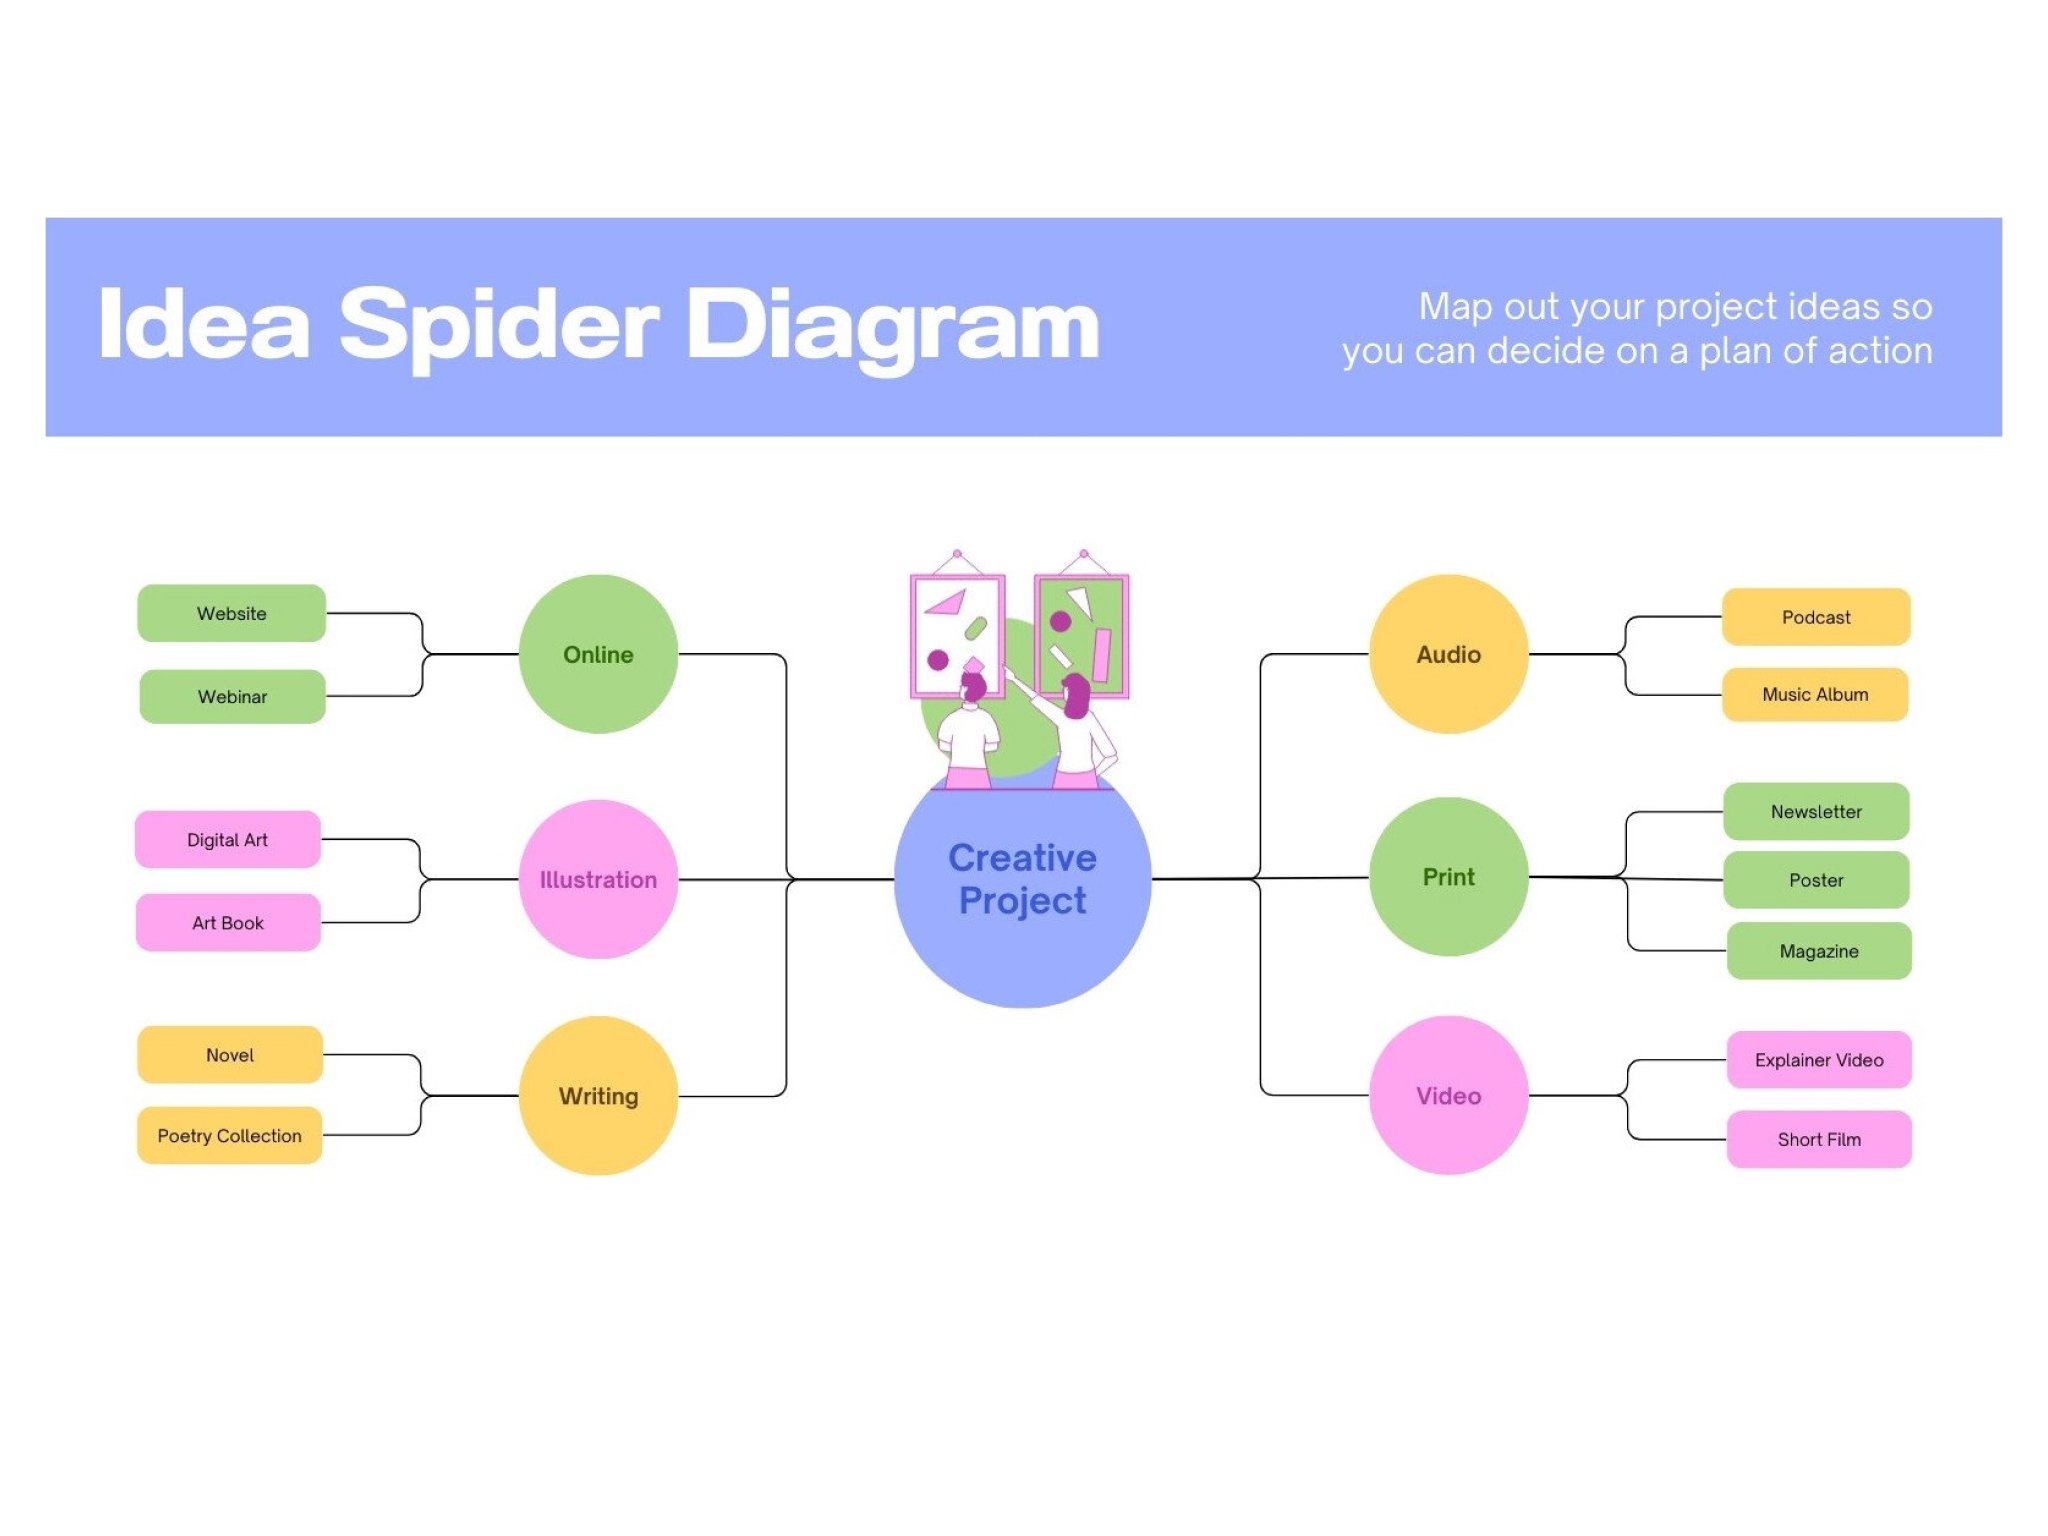
Represent ideas in all forms

Create any diagram required of your data. With our diagram maker, you can show structures, relationships, and business processes—everything from org charts(opens in a new tab or window), circuit diagrams(opens in a new tab or window), to cycle diagrams(opens in a new tab or window). Design diagrams for your pitch decks, class presentations, marketing campaigns, reports—the list goes on. Professional or personal, Canva’s diagram maker is your data viz best friend.
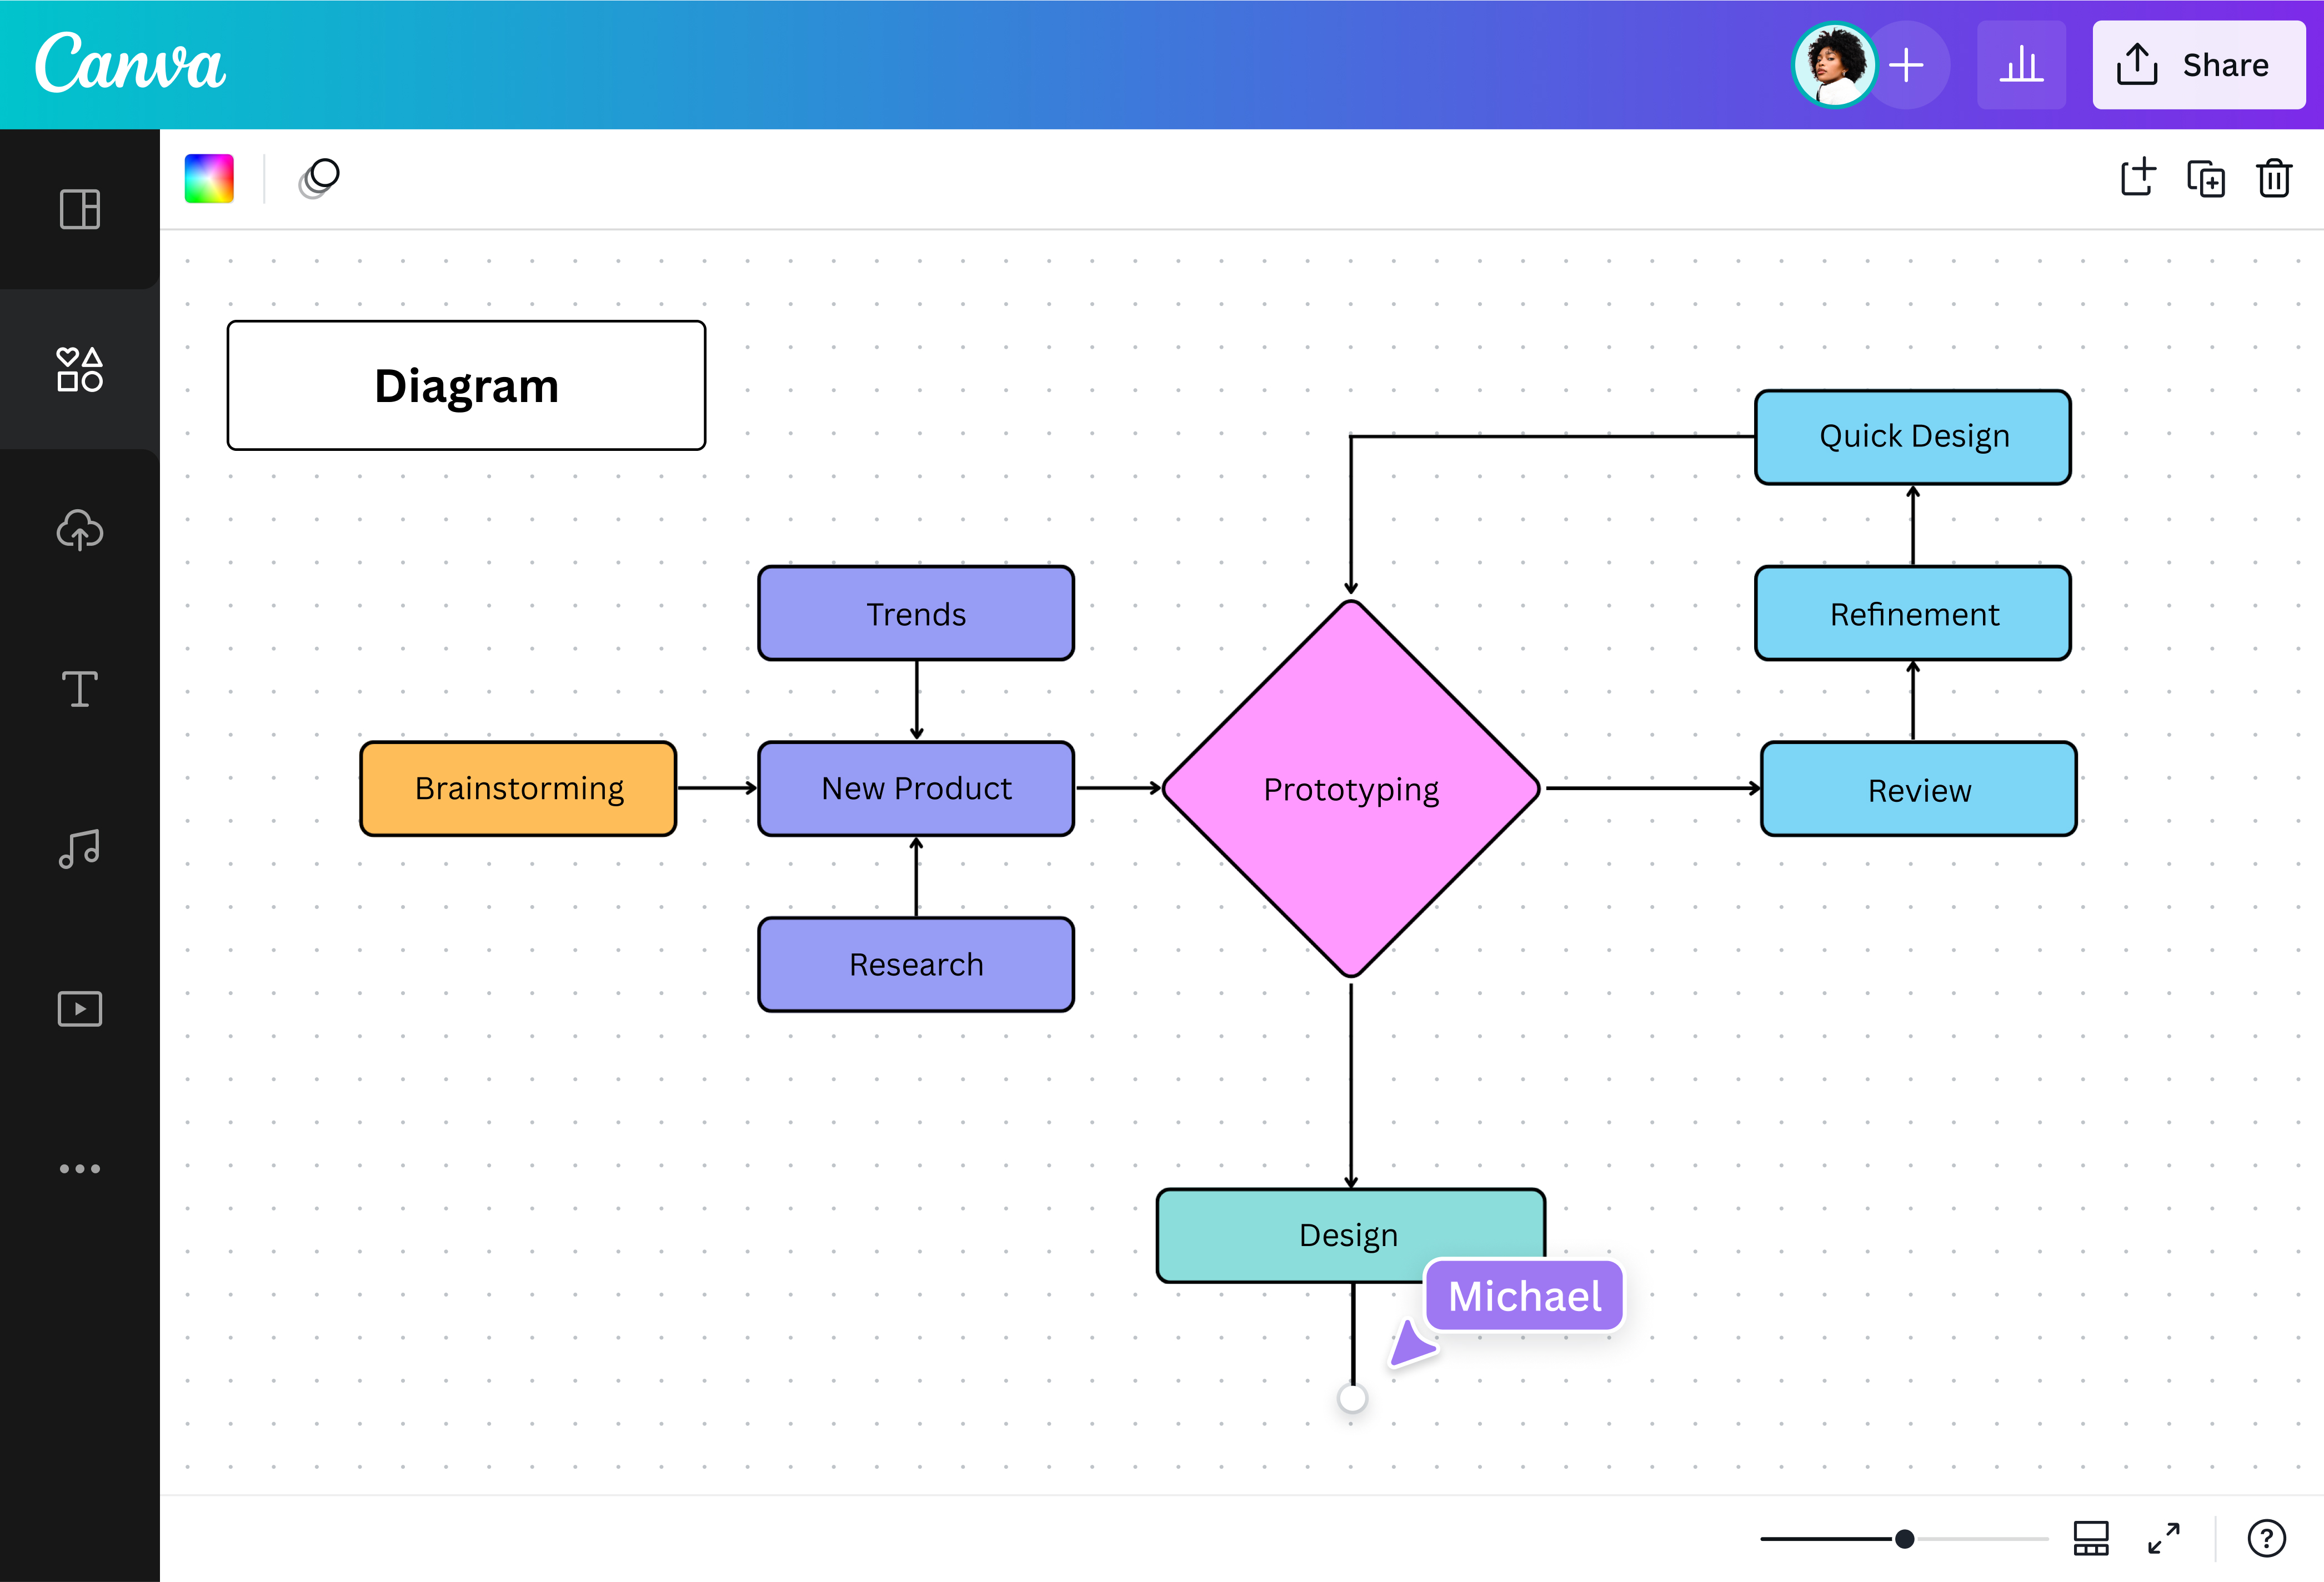
Collaborate with your team

Make a diagram with teammates, wherever they are. Just send them a link to your whiteboard for real-time collaboration. Anyone can edit the diagram, tag teammates in comments, add ideas on virtual sticky notes, and leave reaction stickers. Canva Whiteboards also has real-time mouse pointers and a built-in timer for productive brainstorming sessions. Teamwork truly makes the dream diagram work.
Make all types of diagrams in one place

Need to make a PERT chart(opens in a new tab or window), fishbone(opens in a new tab or window), a Venn diagram(opens in a new tab or window), and a UML diagram(opens in a new tab or window)? Don’t sweat it—you can create all types of diagrams on Canva Whiteboards. With varied diagram templates, you can complete any data visualization project. Enjoy easy drag-and-drop editing and thousands of free illustrations for every type of diagram. On top of that, there’s an infinite canvas that can house all the diagrams you need.
Customize with fun elements

Diagrams don’t have to be boring, so jazz it up with free design elements. Pick nice shapes for each data point, connect them with fancy arrows, and add cute icons and bold colors. Want to sketch while diagramming? Use Draw(opens in a new tab or window), our awesome drawing tool. If you’re adding photos, enhance them with our built-in photo editor(opens in a new tab or window). You’ll create a diagram that’s equal parts form and function.
Diagram templates


Matylda
Frequently Asked Questions
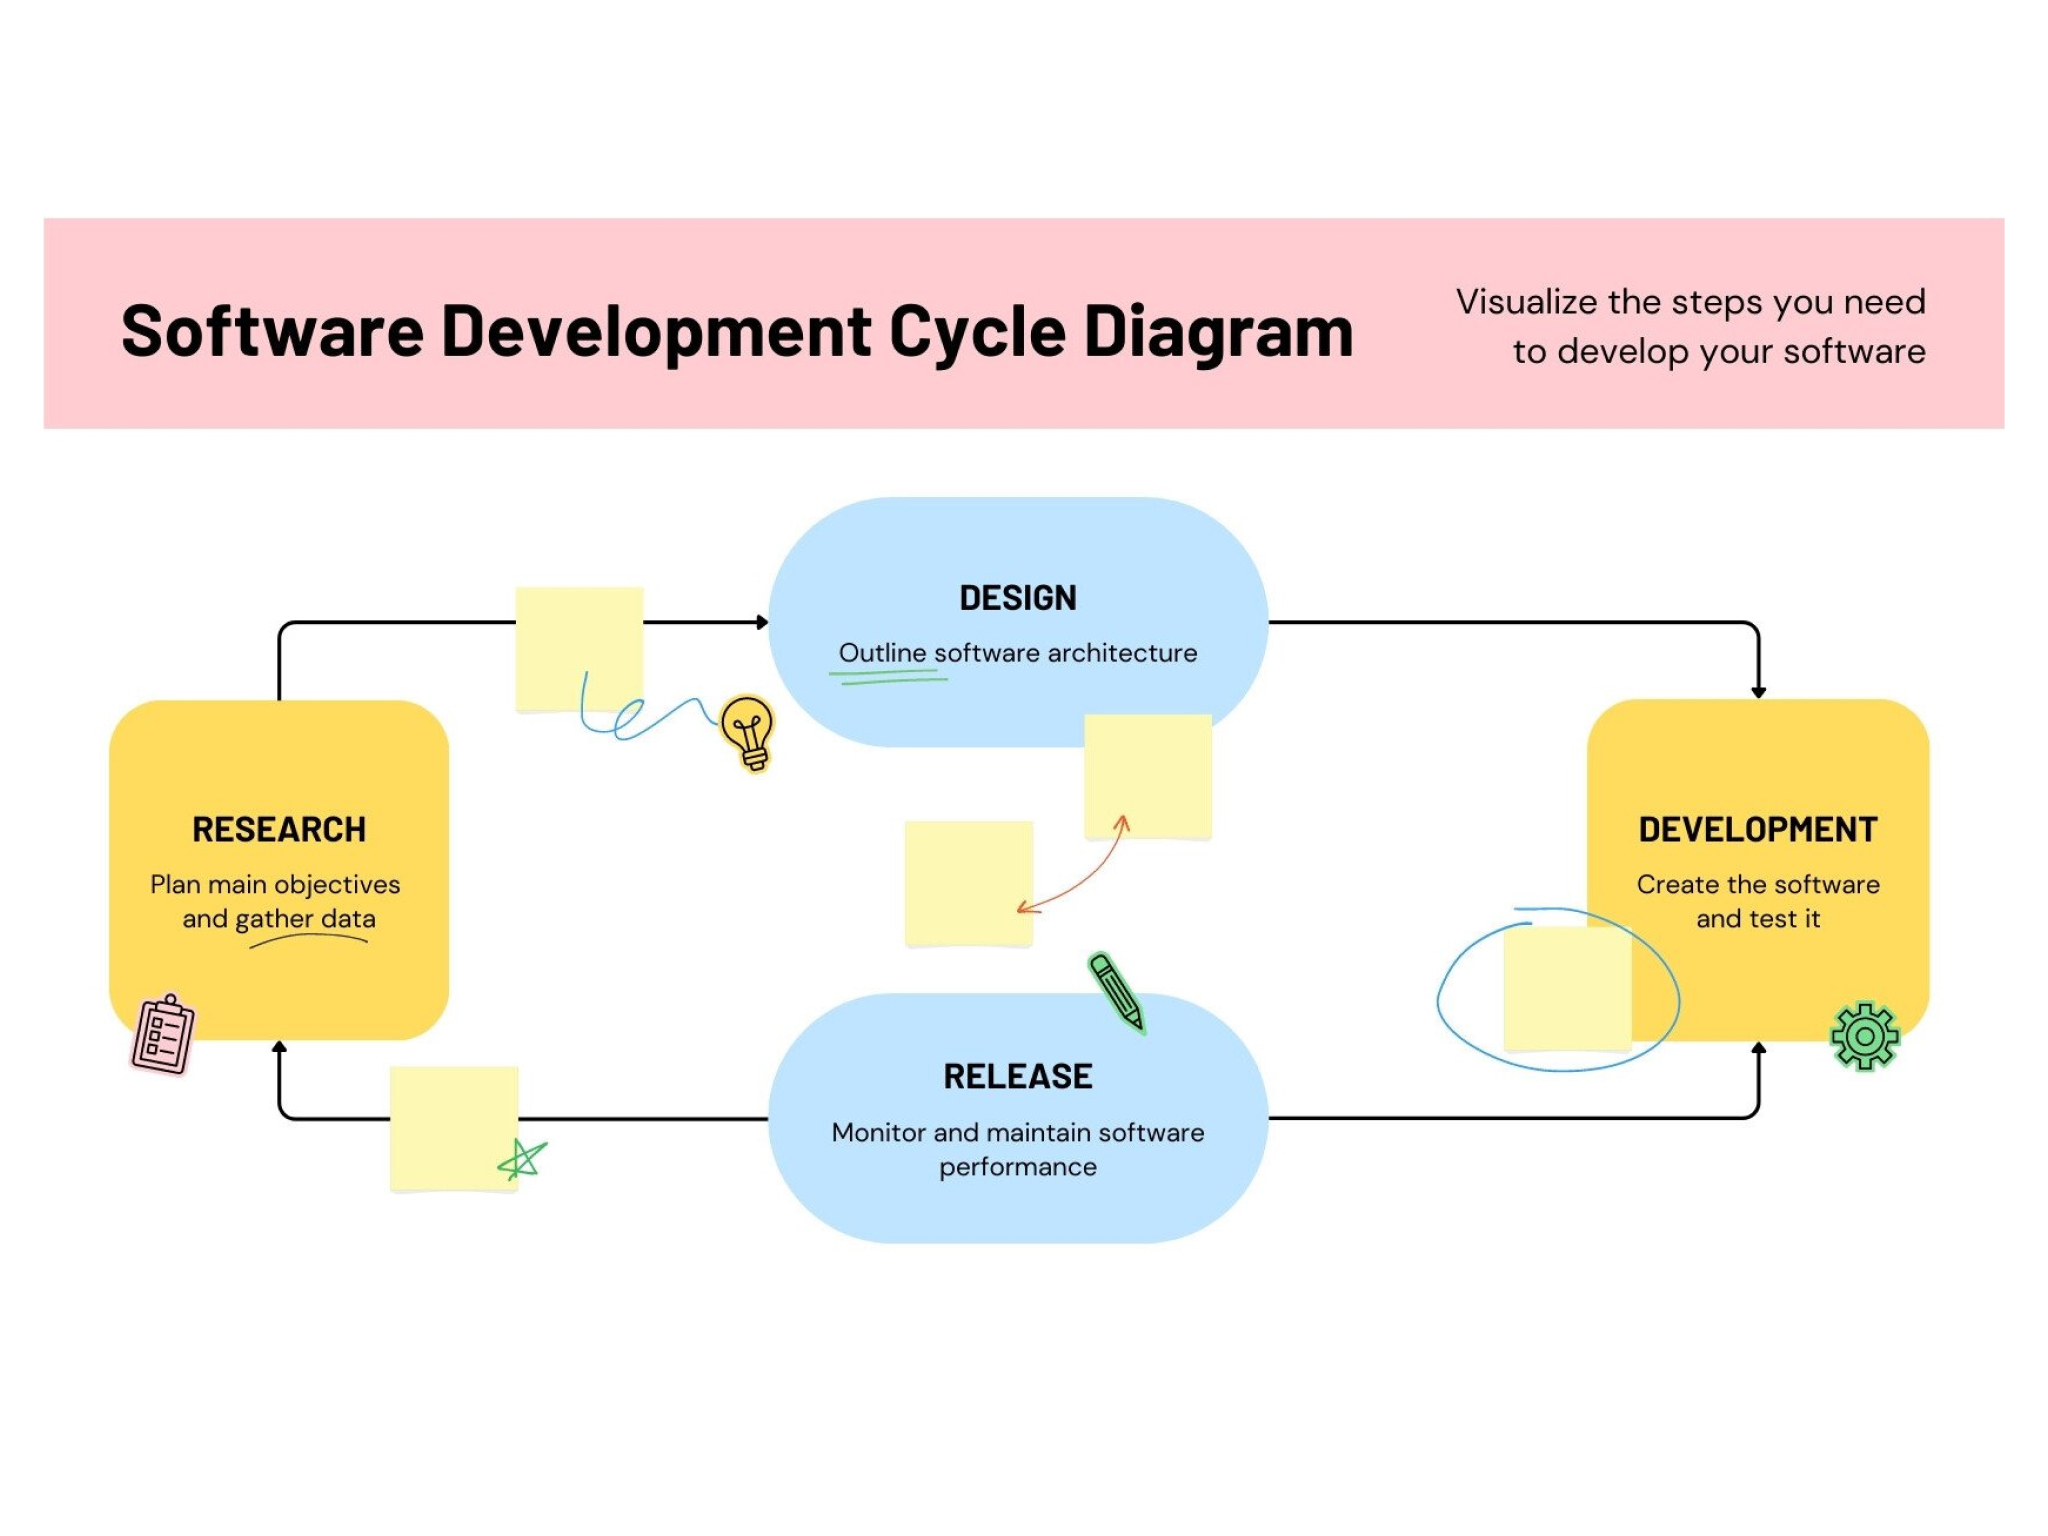
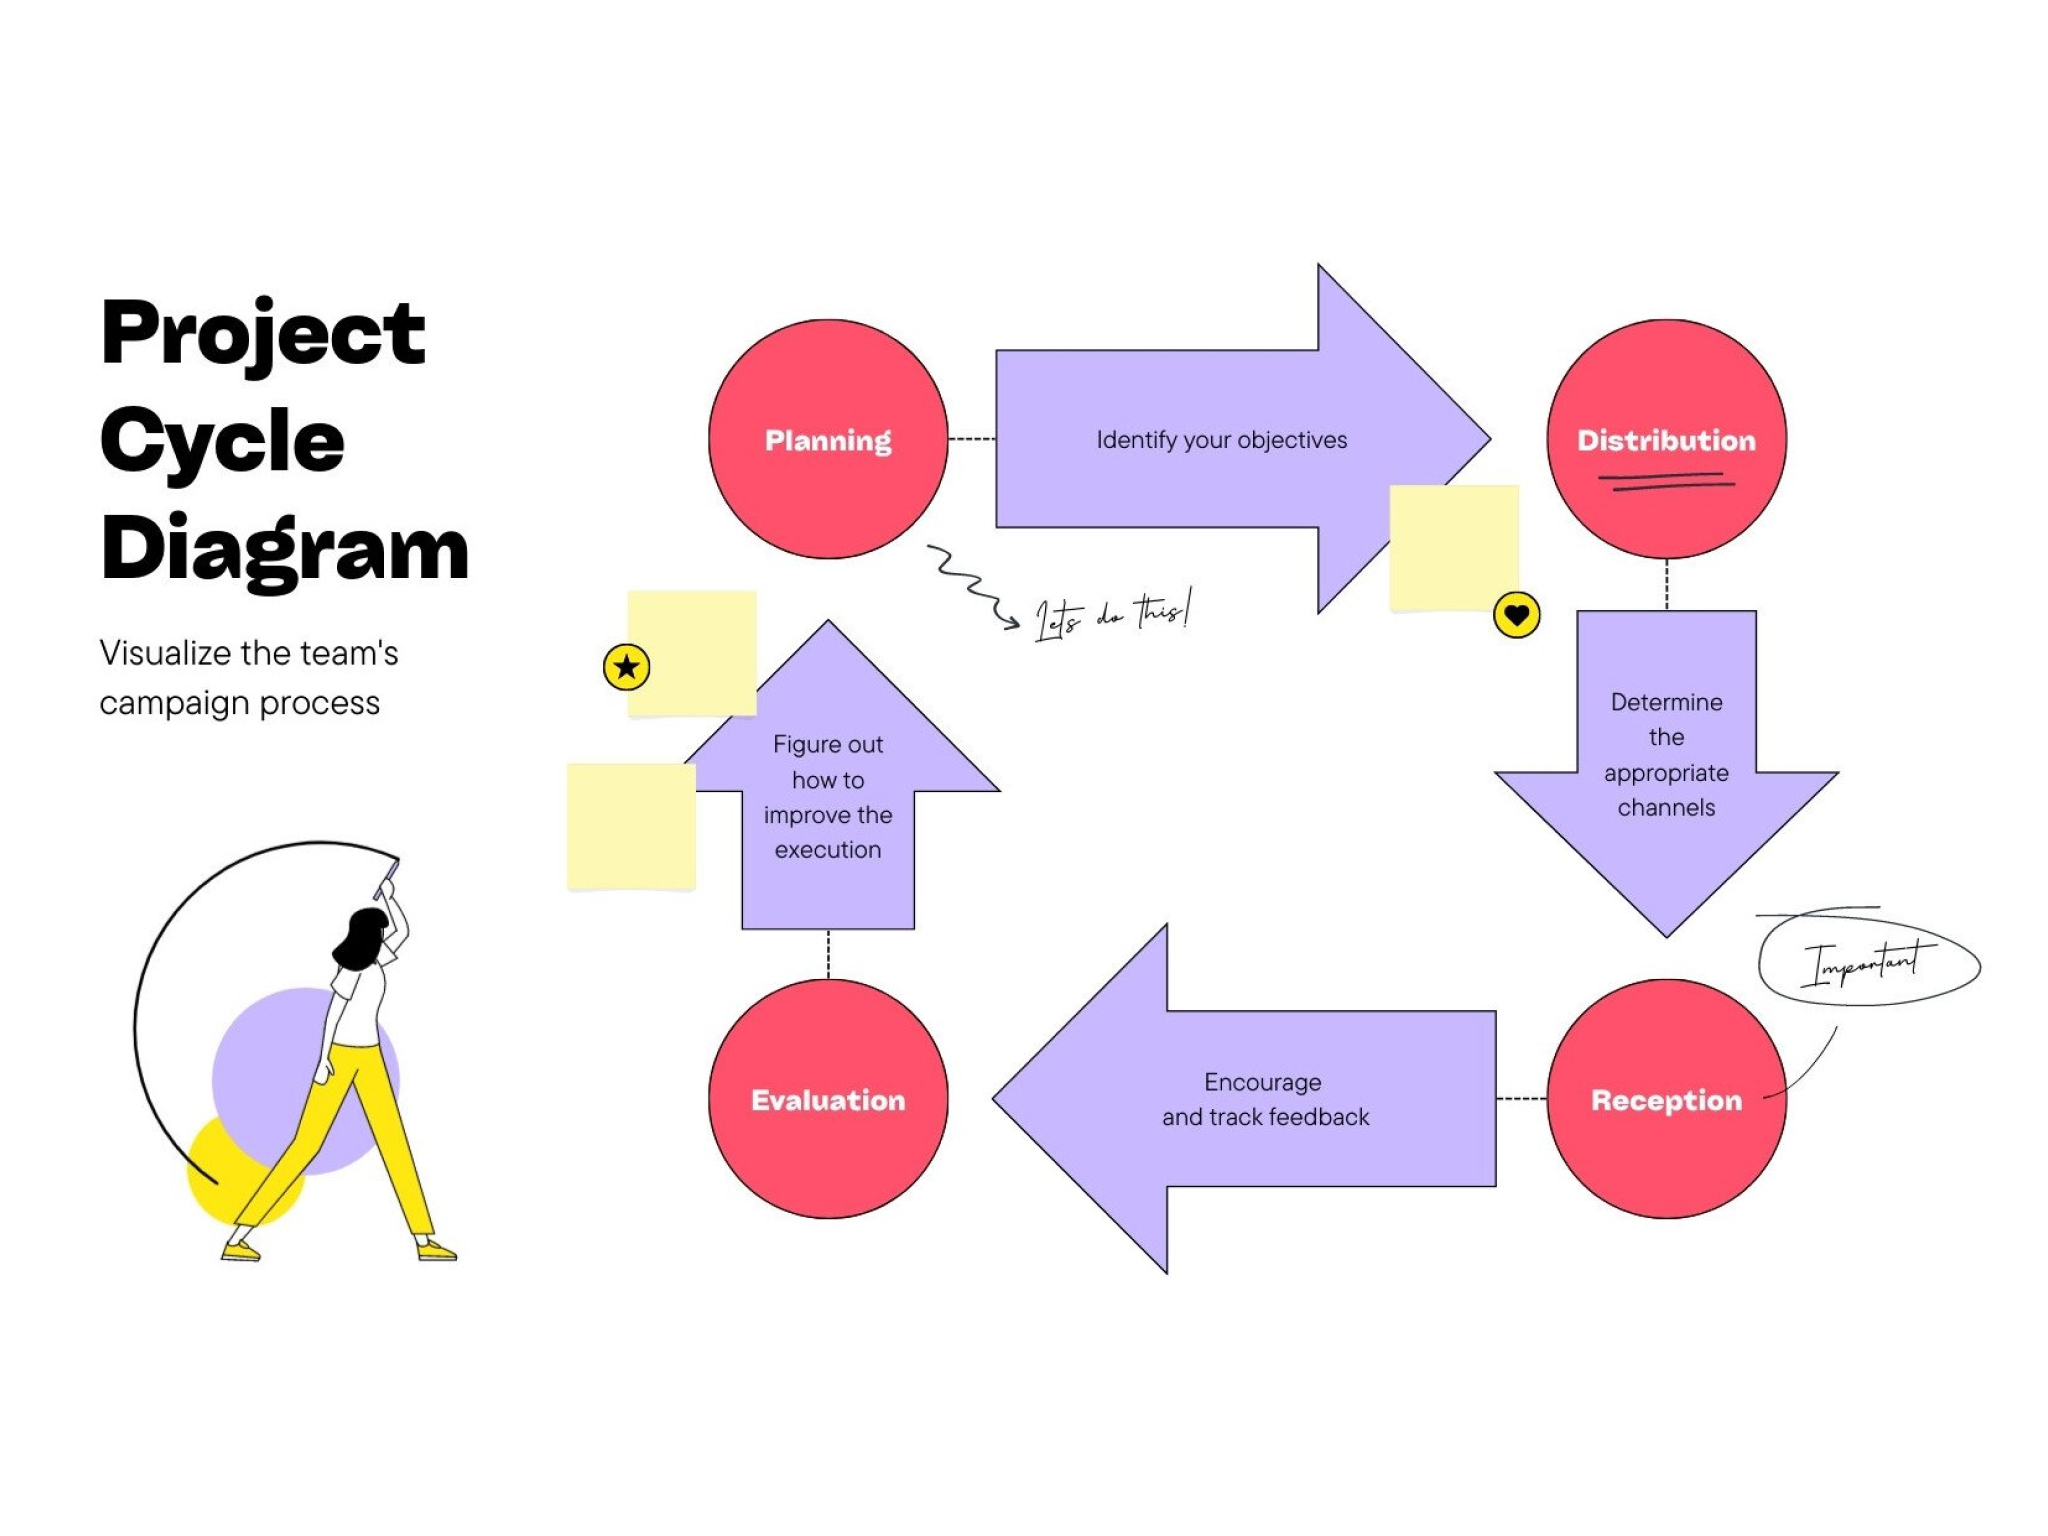
- It depends on the type of diagram. Different diagrams have different components. For example, a family tree diagram looks like a tree with nodes and branches. Meanwhile, a block diagram has blocks connected by arrows, and a cycle diagram consists of elements arranged in a circle, also connected by arrows. Diagrams are diverse, so the look will depend on your data.
- Use our online whiteboard tool to make diagrams online for free. Our free templates get you started quickly, and there’s a free media library to help you customize your diagram. Download our app, too, so you can go diagramming anytime, anywhere.
- A graph usually represents numerical data and quantifiable variables. Graphs make it easy to understand and interpret statistical information. In contrast, a diagram usually illustrates things that are more abstract, like concepts, structures, ideas, or parts of a whole. It shows how something works or how one thing relates to another.
- A good diagram is clear, readable, and well-designed. Make sure your team uses the right diagram for the concept or data. The arrangement must be tidy—use spaces and borders to distinguish each section of the diagram. Use colors to group things together. For typefaces, stick with a single font, then use different font weights (light, bold, etc.) to highlight information. Our diagram maker offers lots of good examples of clear, well-designed diagrams.
- Different types of diagrams have a different purpose. When you make Venn diagrams, for example, you aim to compare and contrast. When you make a fishbone diagram, you aim to find out the root cause. There are as many purposes as there are diagram types, so you have to choose the right one for your data.