- ER Diagrams

ER diagrams
ER diagram maker features
Present how connected your data is to one another with Canva’s online ER diagram maker for free. Choose a template from our collection of ER diagram examples and personalize it to suit your database. Easily look for symbols from our library to visualize entity relationships and do it with help from your team as you collaborate in real-time.
More than 20 professional types of graphs to choose from
Professionally designed templates to fast-track your workflow
Data visualization made easy – no complicated software to learn
Publish, share or download your high-resolution graph
Embed your ER diagram in presentations, reports, and more with no fuss
Easy drag-and-drop tools, made with the non-designer in mind
How to make an ER diagram

What is an ER diagram?
An entity relationship diagram or ERD helps different industries to visualize and find connections between objects and concepts to set up and structure their databases. It is vital in engineering, information systems, education, and research, where entity relationship modeling helps identify logic or design flaws that make production seamless and smoother. ER diagram designs also depend on the level of detail and scope of your data.
The history of ER diagrams

In his search for a unified framework for database modeling, Peter Chen proposed an improved way of visualizing a database through entity relationship models. Before his 1976 paper titled "The Entity-Relationship Model: Toward a Unified View of Data," there were three data models: network, relational, and entity. He merged these existing models and solved the vagueness into ER diagrams or ERDs.
Chen’s entity relationship diagram became the foundation of the IE notation by James Martin in the 1980s and later advances in information systems like the Unified Modeling Language or UML.
Components of an ER diagram

Entity

Relationship

Attribute

Weak entity

Connecting lines

Cardinality
Establish good relationships

ER diagrams thrive on the level of detail and scope. Support all the data you need to showcase using our ER diagram creator. You can identify as many entity relationships as possible with a seamless brainstorming canvas or make an ERD with just the right size for your presentation or infographic. Cover as many details so your team can analyze your process or flow better.
Illustrate with design elements

Visualize each component of your ER diagram well. Our free online ER diagram tool has plenty of lines and shapes that you can use to represent an entity, connect concepts, and display attributes. Use our extensive media library not only as mere symbols but also to set a theme. Backgrounds and vectors are available when you need a tech, business, or abstract feel to your ER diagram.
Relate with colors and fonts

Identify and label your ER diagram properly. Use colors to direct attention to important aspects of your diagram. Need a bright scheme to go with your tropical food store database? Select beautiful color combinations to represent your theme and make texts pop. Choose fonts from our library that’ll help your ER diagram become legible and readable to anyone.
Collaborate and connect easily

Complete your ER diagram with your team. Share a link to your design and give editing access to your members. Work simultaneously by applying changes and leaving comments. Draw your ER diagram online to document your database, troubleshoot your information system, or map out your diagram through brainstorming. Then, send it via email, embed it on your websites, or print it as a report.
ER diagram templates


Assem A
Frequently Asked Questions
- An entity relationship model is a high-level data model that acts as a blueprint and depicts how a database is structured logically and visually. It’s not mutually exclusive to an ER diagram since it’s only a subset of it. So, you can also picture an idea from an ER model through an ER diagram.
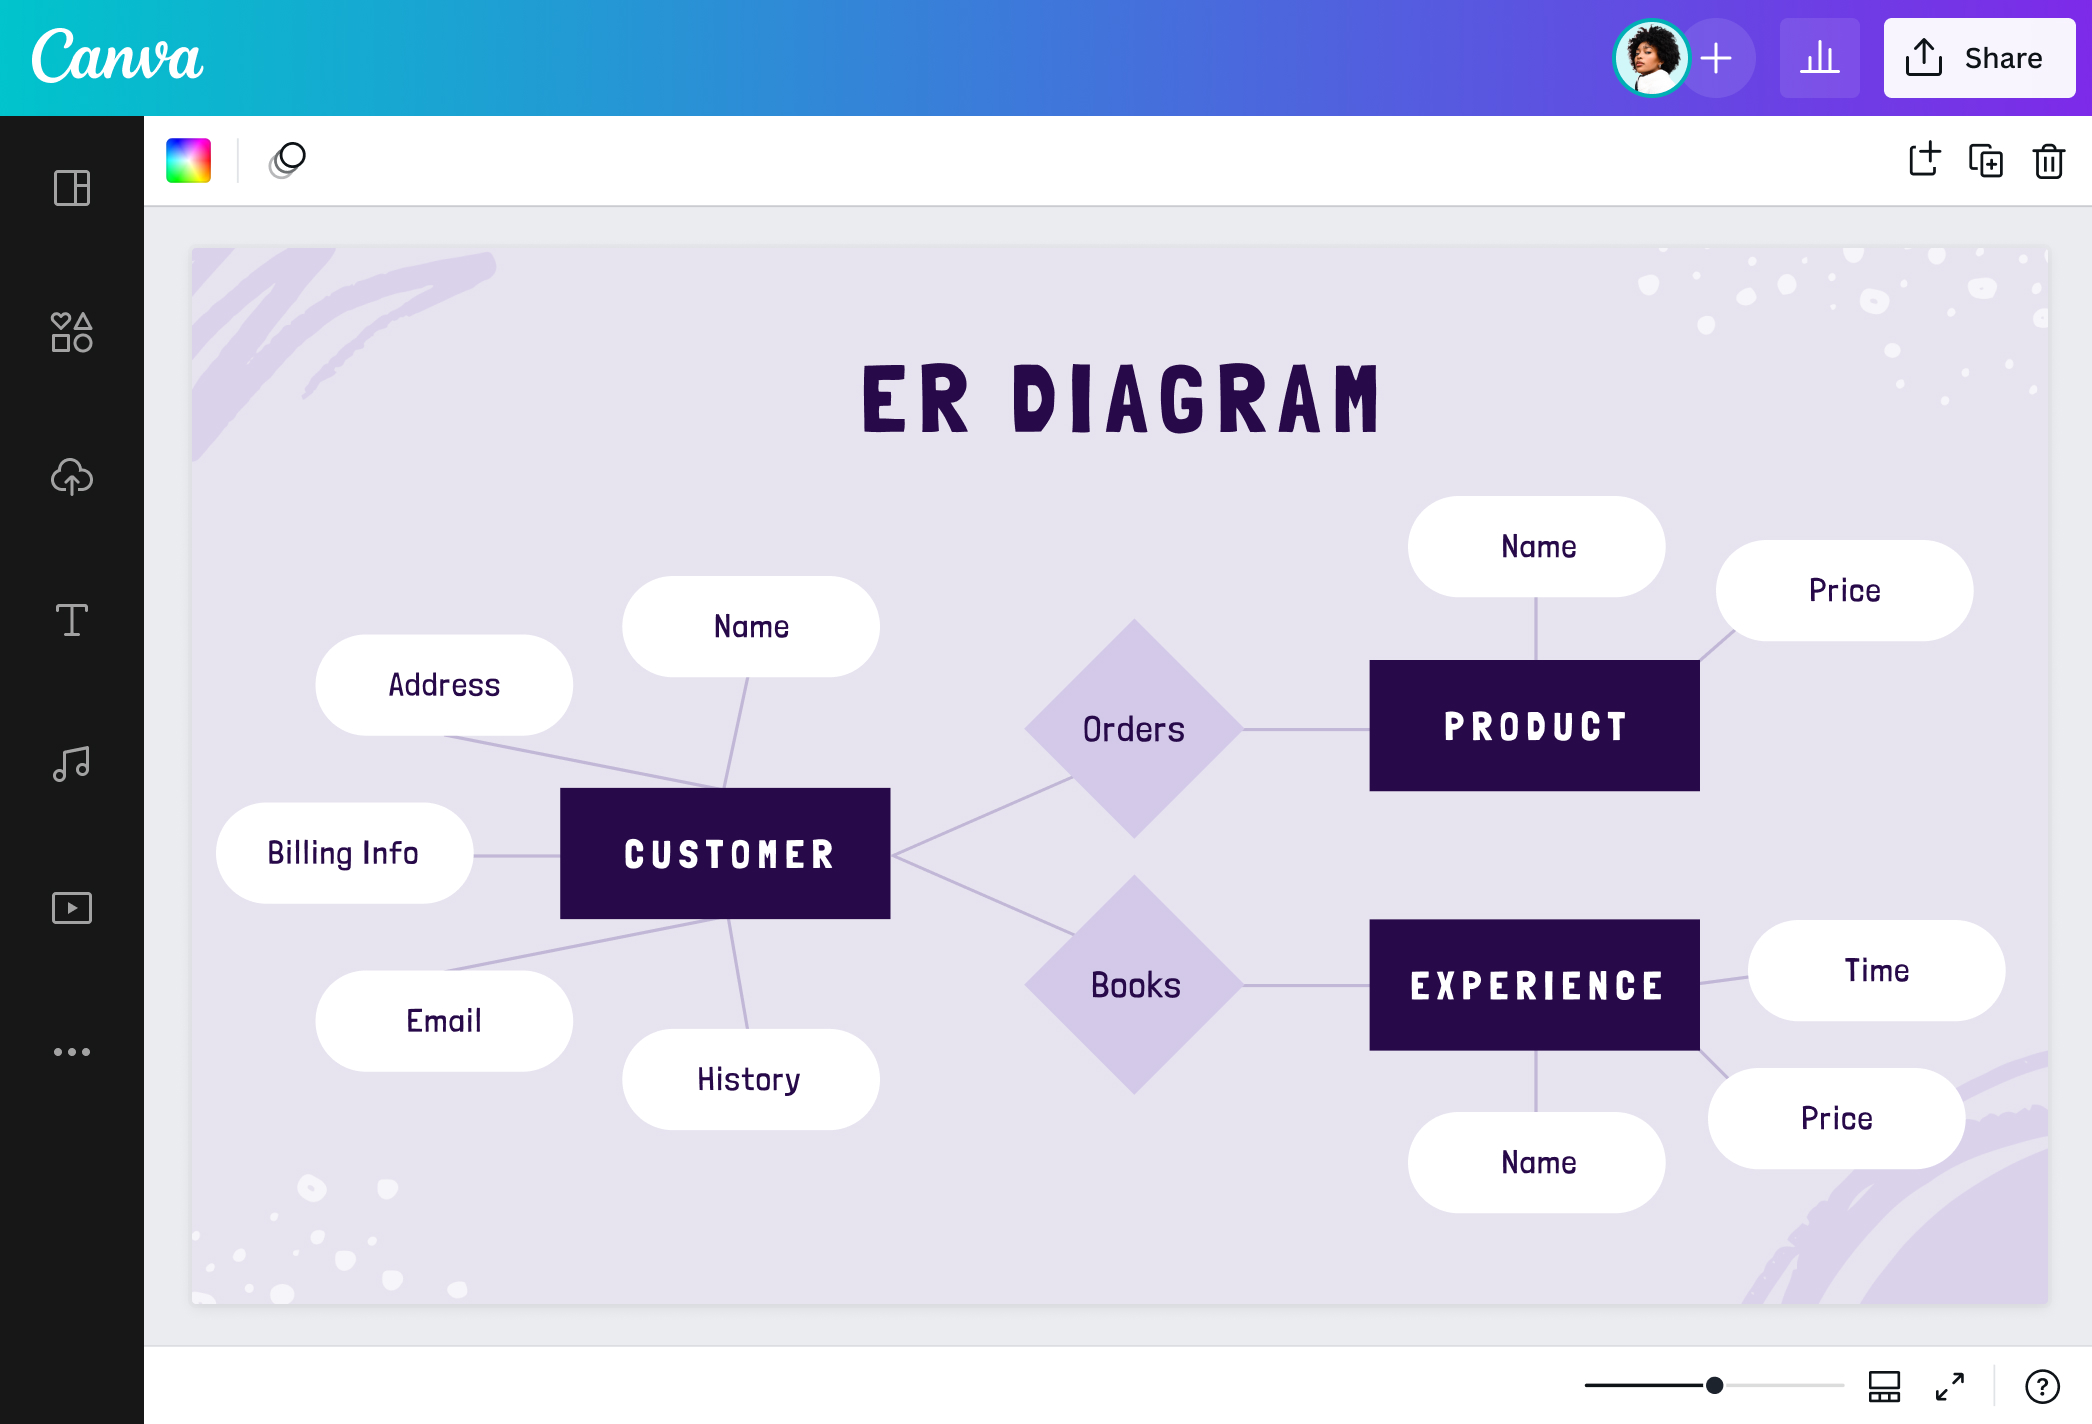
- An ER diagram is composed of entities, relationships, and attributes. Entities are concepts or objects that collect information, often represented as nouns. Relationships depict how two entities are connected, labeled as verbs. An attribute provides a character unique to an entity.
- Common symbols present in an ER diagram are rectangles for entities, diamonds for relationships, and ovals for attributes. Connecting lines visualize the connection of attributes between entities and relationships. Arrows define cardinality or the amount of data from an entity and may differ based on the notation or style used.
- ER diagrams are important because they visualize your data flow. They help many industries to identify redundant entities and bottlenecks in their information system to create a streamlined business process or tool.
- Be familiar with the components and symbols of an ER diagram first. Then, look out for the notation style used since it represents cardinality. Some of the notation styles that can be used are Information Engineering (IE) Style or Crow’s Foot Notation, Chen Style, and Bachman Style. From there you can read the different relationships expressed: one-to-one, one-to-many, many-to-one.