- Ecomap
Free online ecomaps
Create an ecomap online
Easily make a visual representation of the social and environmental factors that may be affecting a person’s life. Our free ecomap maker helps you establish connections and dynamics that family, society, and community contribute to an individual using visual elements from our rich media library. Invite your team and create an ecomap online using free templates and various collaboration tools and features on Canva Whiteboards.
Infinite space made for unlimited ideas
Professionally designed templates to fast-track your workflow
Share and ideate with anyone, anytime, on any device
Run a workshop with whiteboard elements, sticky notes, and a timer
Embed your ecomap in Docs, presentations, and more easily
Easy online whiteboard tools and data visualization
How to make an ecomap


What is an ecomap?
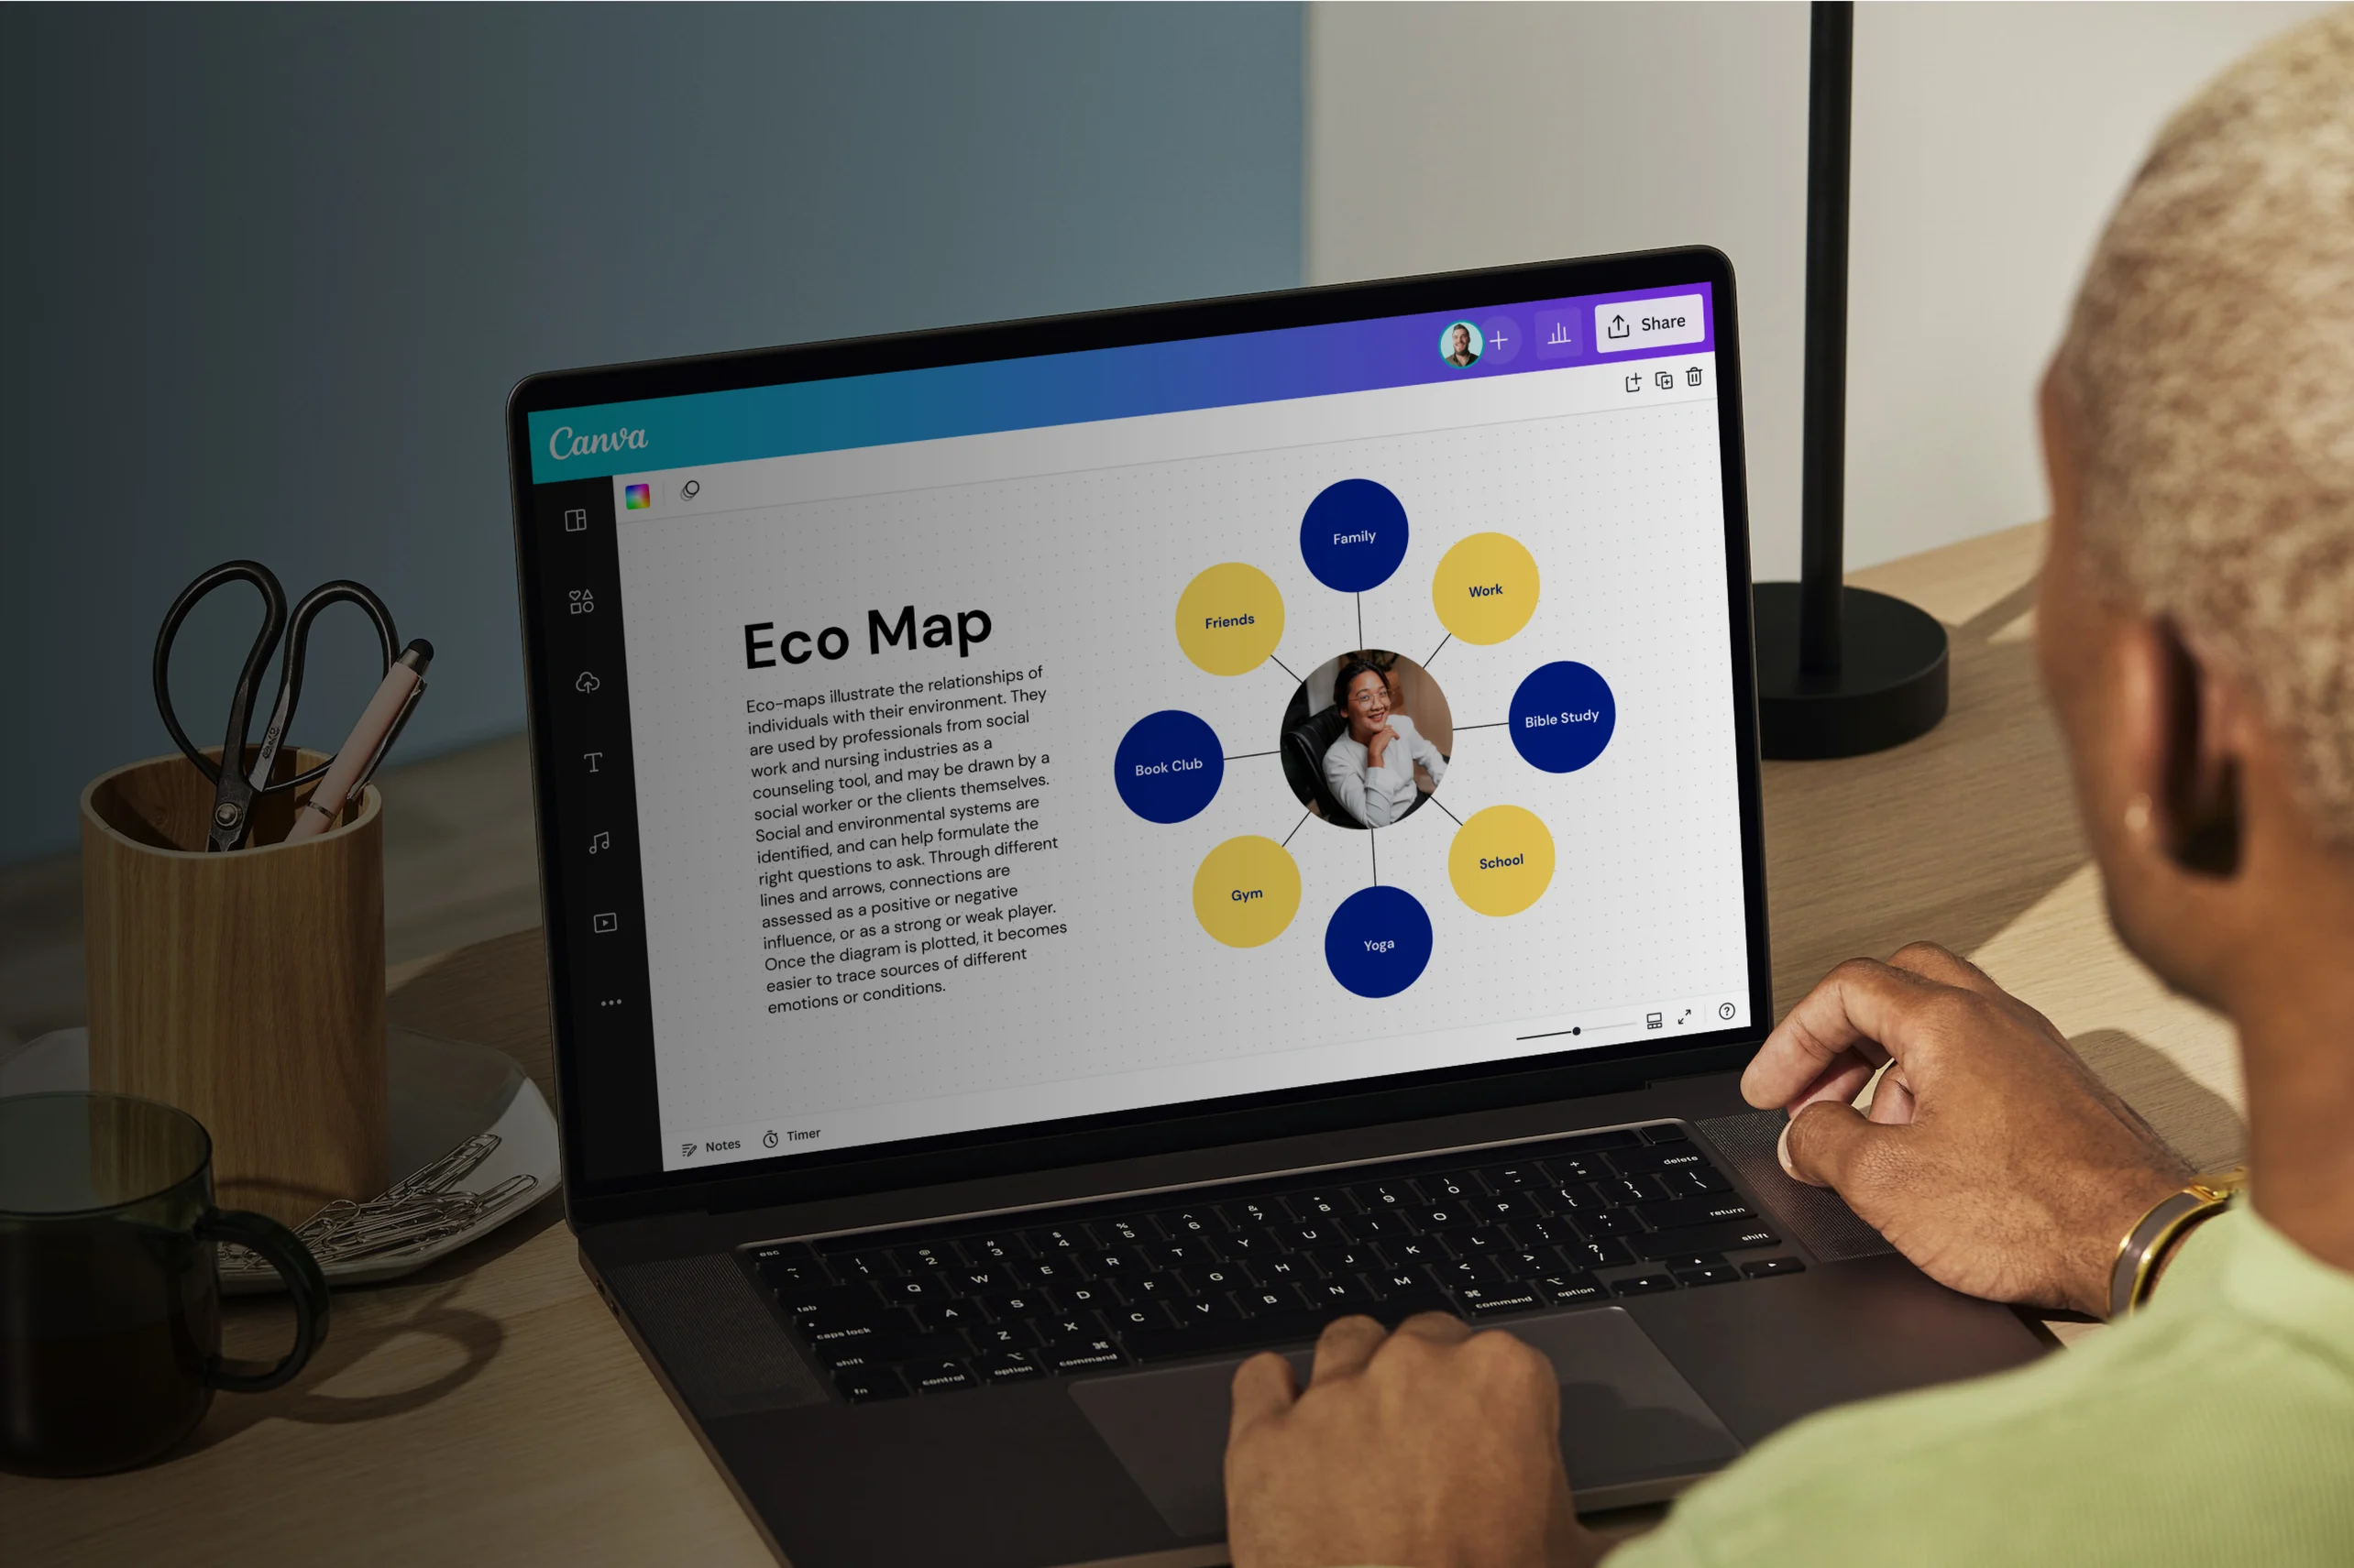
An ecomap is a graphical representation of the personal and social relationships between an individual or family and their environment. However, this chart goes beyond merely identifying biological relationships — it also takes external connections (and the quality of said connections) such as friendships, clubs, or institutions into consideration.
Why use ecomaps?

Often used by counselors, social workers, and nurses, ecomaps can help assess an individual’s family dynamics and community connections. They reveal which relationships may benefit from support and which bonds appear solid.
Additionally, they’re used to identify stressors or causes of anxiety and depression. With ecomaps, you can better navigate a person’s relationships and construct an effective plan for intervention or treatment, similar to how a genogram(opens in a new tab or window) helps analyze family structures and emotional ties.
Map out connections clearly

Your client’s relationships may be complicated, but mapping them out doesn’t have to be. Canva Whiteboards has a collection of ecomap templates that are free to use and customize. Choose a design example to get started quickly. With Canva, you can skip the learning curve and focus on what really matters: getting valuable insights and information into a person’s existing relationships.
Use lines and shapes

When creating an ecomap diagram, use various symbols, shapes, and lines to show interconnections and relationship dynamics. Add them to your whiteboard by going to the Elements tab. Click on Shapes or Lines and choose a design that works best for your needs. Shape Assist lets you modify your shapes, lines, and arrows to establish how strong or weak a relationship is in your ecomaps.
Add style to your data

Professional-looking ecomaps don’t have to be boring. Spruce up your design with fun elements to make it more engaging. From Canva’s curated media library, you can add graphics, images, icons, and more to your ecomap. Play around with fonts and color palettes to find the perfect combination that matches your client’s personality. Use Text to Image(opens in a new tab or window) or Draw(opens in a new tab or window) to get your vision across.
Work with your team

Creating an ecomap requires a collaborative effort. Share access to your whiteboard with your team and watch them make edits in real time. Brainstorm ideas on sticky notes(opens in a new tab or window) or ask for input and resources by tagging team members in comments. And with your whiteboard’s infinite canvas, you and your team will never run out of space to work on and refine your ecomap.
Start inspired with an ecomap template


Assem A
Frequently Asked Questions
- When creating an ecomap, make sure to have your subject’s name in the center of the graph. Put down the relationships, environments, and external factors in different circles around the subject, connecting them with lines and arrows that depict the quality of the bonds. Thick, solid lines often denote strong, positive connections, while lines with hatch marks indicate stressful relationships.
- On your whiteboard, you’re free to edit your text in various ways to ensure it aligns with your specific vision. Use Canva’s text tools to change the font type, size, color, emphasis, alignment, spacing, and transparency. You can start applying changes by selecting the text box you wish to edit and clicking on the format options in the toolbar.
- Yes, you can edit and save your ecomap as much as you like. Your whiteboard is automatically saved in your account, so you access and revise it whenever inspiration strikes — on any device, wherever you are.