- Venn Diagrams

Free online Venn diagrams
Create a Venn diagram online
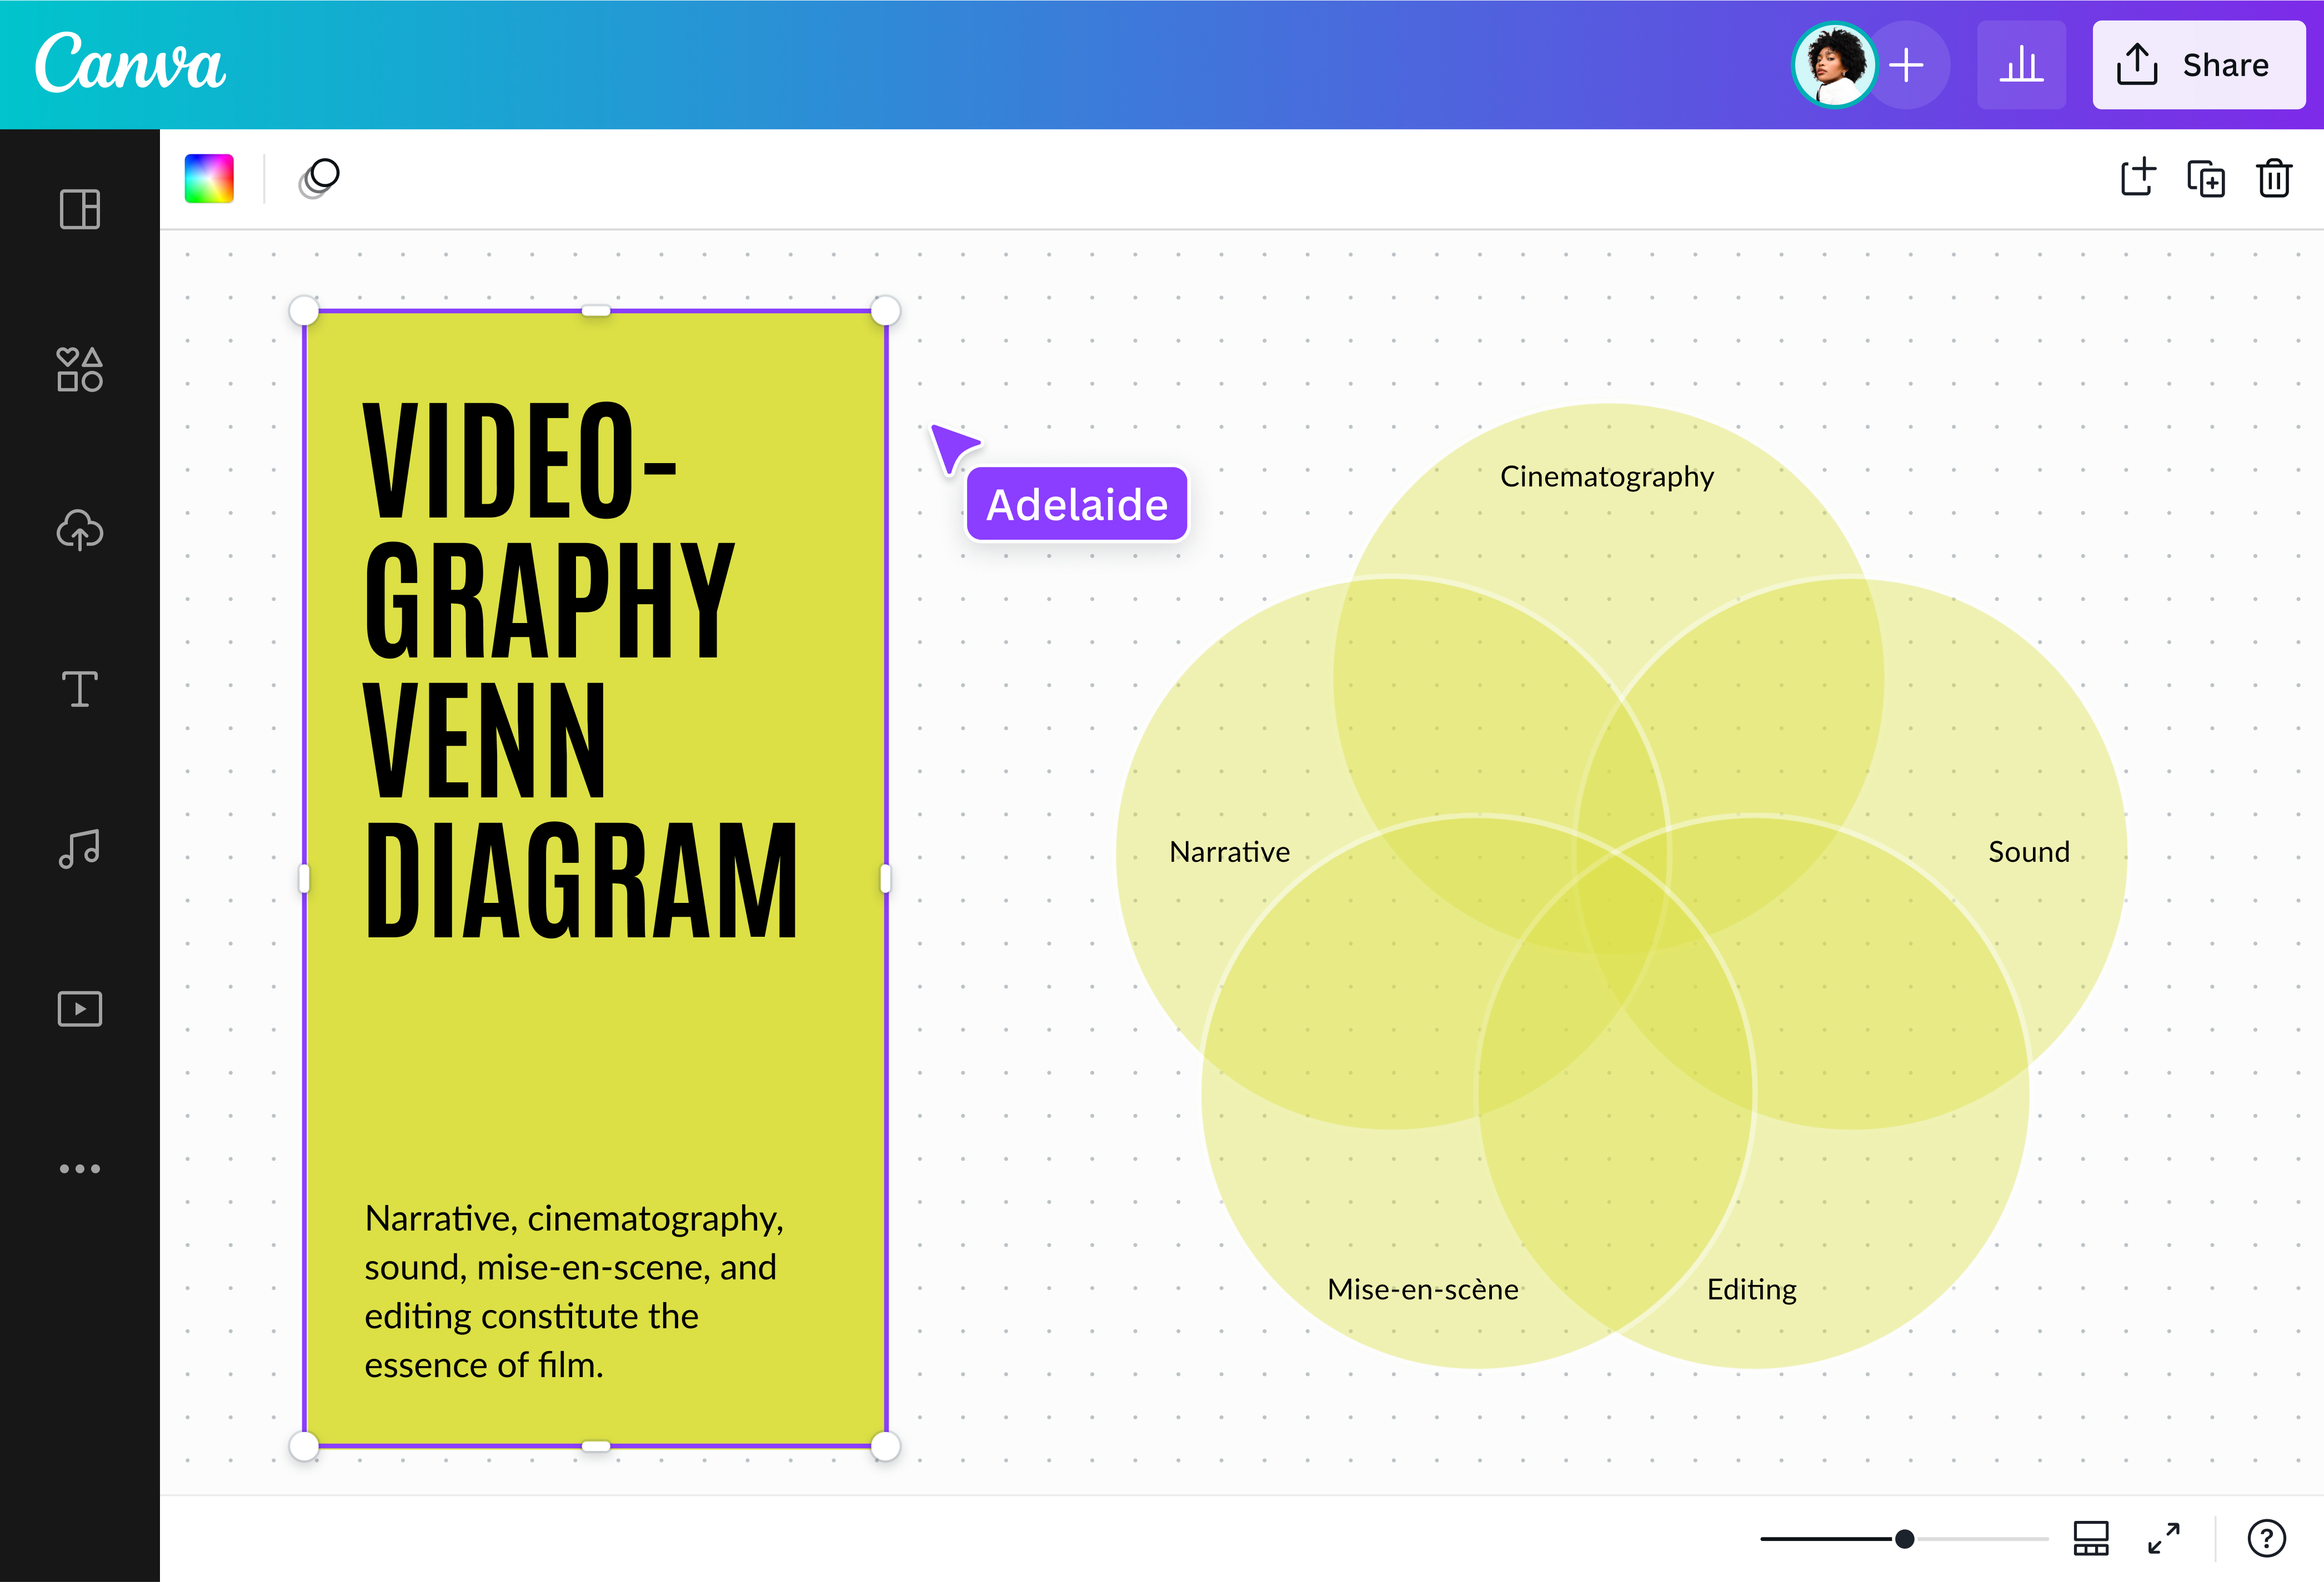
Canva’s Venn diagram maker is the easiest way to make a Venn diagram online. Start by choosing a template from hundreds of Venn diagram examples. With Canva Whiteboard’s suite of visualization and collaboration tools — plus an infinite canvas space — you and your team can create comprehensive and easy-to-digest Venn diagrams.
Infinite space made for unlimited ideas
Professionally designed templates to fast-track your workflow
Share and ideate with anyone, anytime, on any device
Run a workshop with whiteboard elements, sticky notes, and a timer
Embed your Venn diagram in Docs, presentations, and more easily
Easy online whiteboard tools and data visualization
How to make a Venn diagram

What is a Venn diagram?
A Venn Diagram shows the relationships between concepts, mainly their similarities and differences. It consists of two or more overlapping circles and the area around them. Each of the circles represents a different category of data, and the overlapping parts, called the intersection, show where those categories of data have something in common. The area outside encapsulates the data that doesn’t fall into those categories. When you have multiple sets of data to represent, you can create a triple Venn diagram, or even a four circle Venn diagram.
The history of Venn diagrams

The use of circular diagrams has been traced back to as early as the 13th century. Venn diagrams were popularized by the English logician John Venn in 1880 and may also be referred to as a primary diagram, logic diagram or set diagram.
John Venn was inspired by the 18th-century Swiss mathematician and logician Leonhard Euler, who had used a similar approach to organizing data with circles – although his circles did not overlap. Euler’s invention is sometimes referred to as Euler diagrams, and Venn called his own invention as “Eulerian circles”. Around 30 years later, the name Venn diagram was coined.
Venn diagrams were invented for use in a branch of mathematics called set theory. Set theory deals with well-defined categories of objects, including but not limited to numbers.
Why use Venn diagrams?

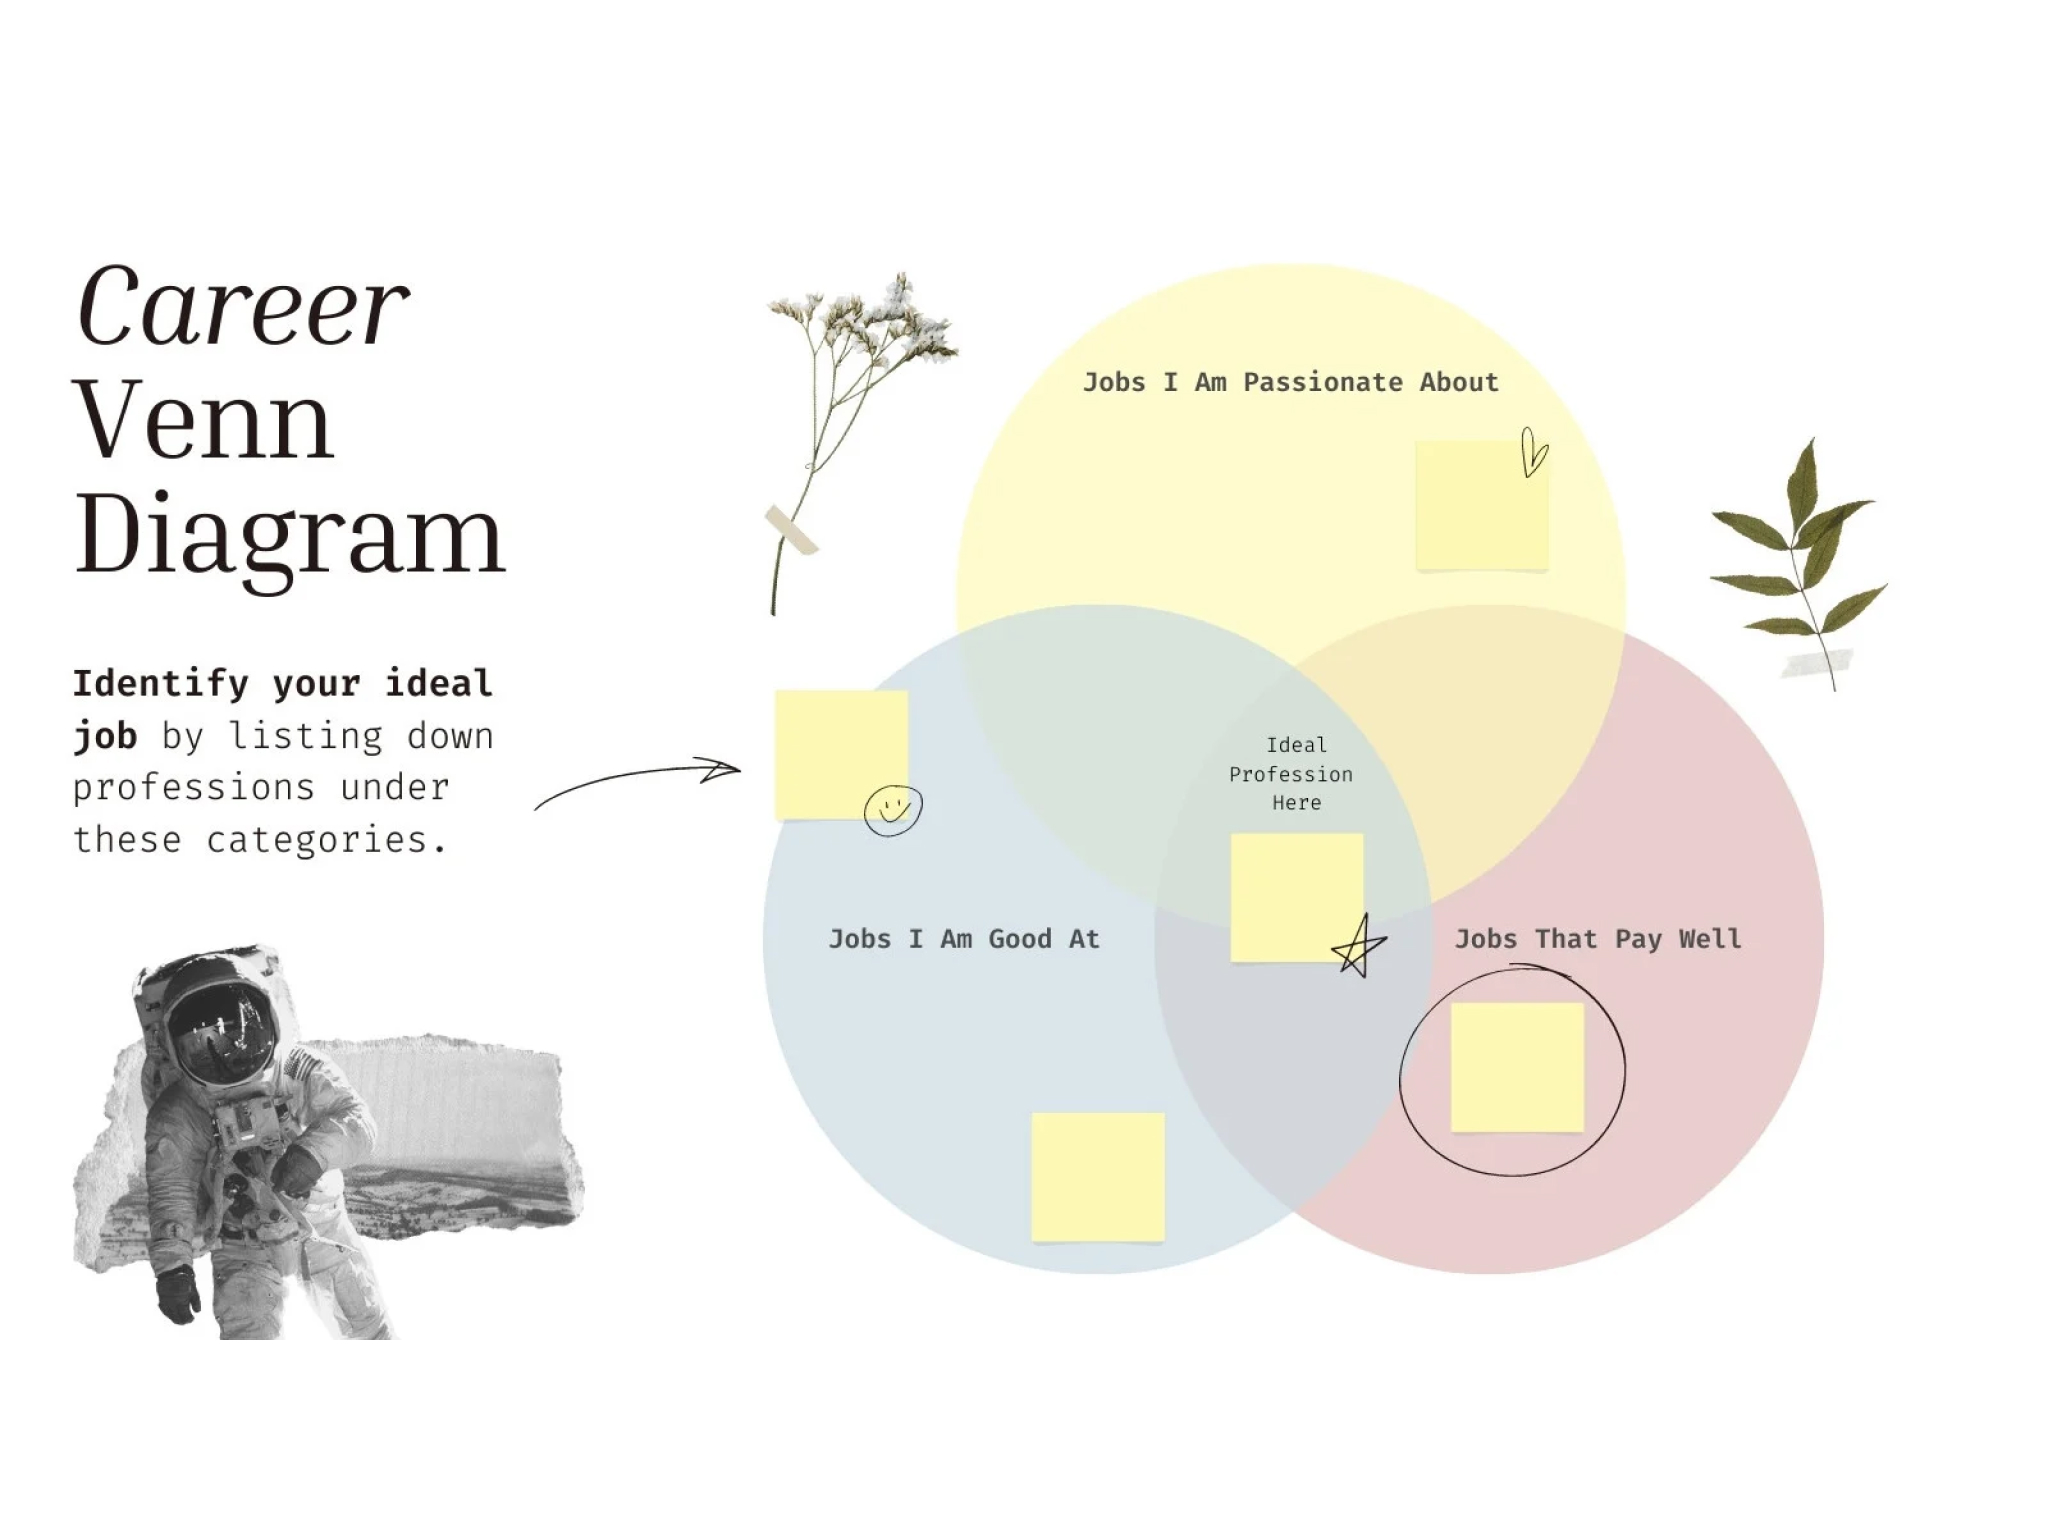
When you’re asked by your teacher or your teammate to write an analysis comparing two or more concepts, visualizing them can help you plot your comparisons better. Venn diagrams in particular are useful for this task. With this circle diagram, your ideas are laid together side by side in simple shapes, giving you an overview that helps you easily identify their differences and similarities.
As a result, not only do you understand the characteristics of your ideas much better, you also become familiar with how they relate to each other. Overall, you’ll gain better expertise of your subject for your school essays, research papers, and business reports.
Components of Venn diagrams

Intersection

Union

Symmetric difference

Relative complement

Absolute complement

Universal set
Compare ideas like a breeze

Whether you’re making a Venn diagram for your math assignments, class reports, or market research, create it with ease using Canva’s online whiteboard tool. No more complex Venn diagram makers—just drag and drop your elements, and find features like shapes, text, and AI tools from the side panel.
Stunning diagrams that compare like no other

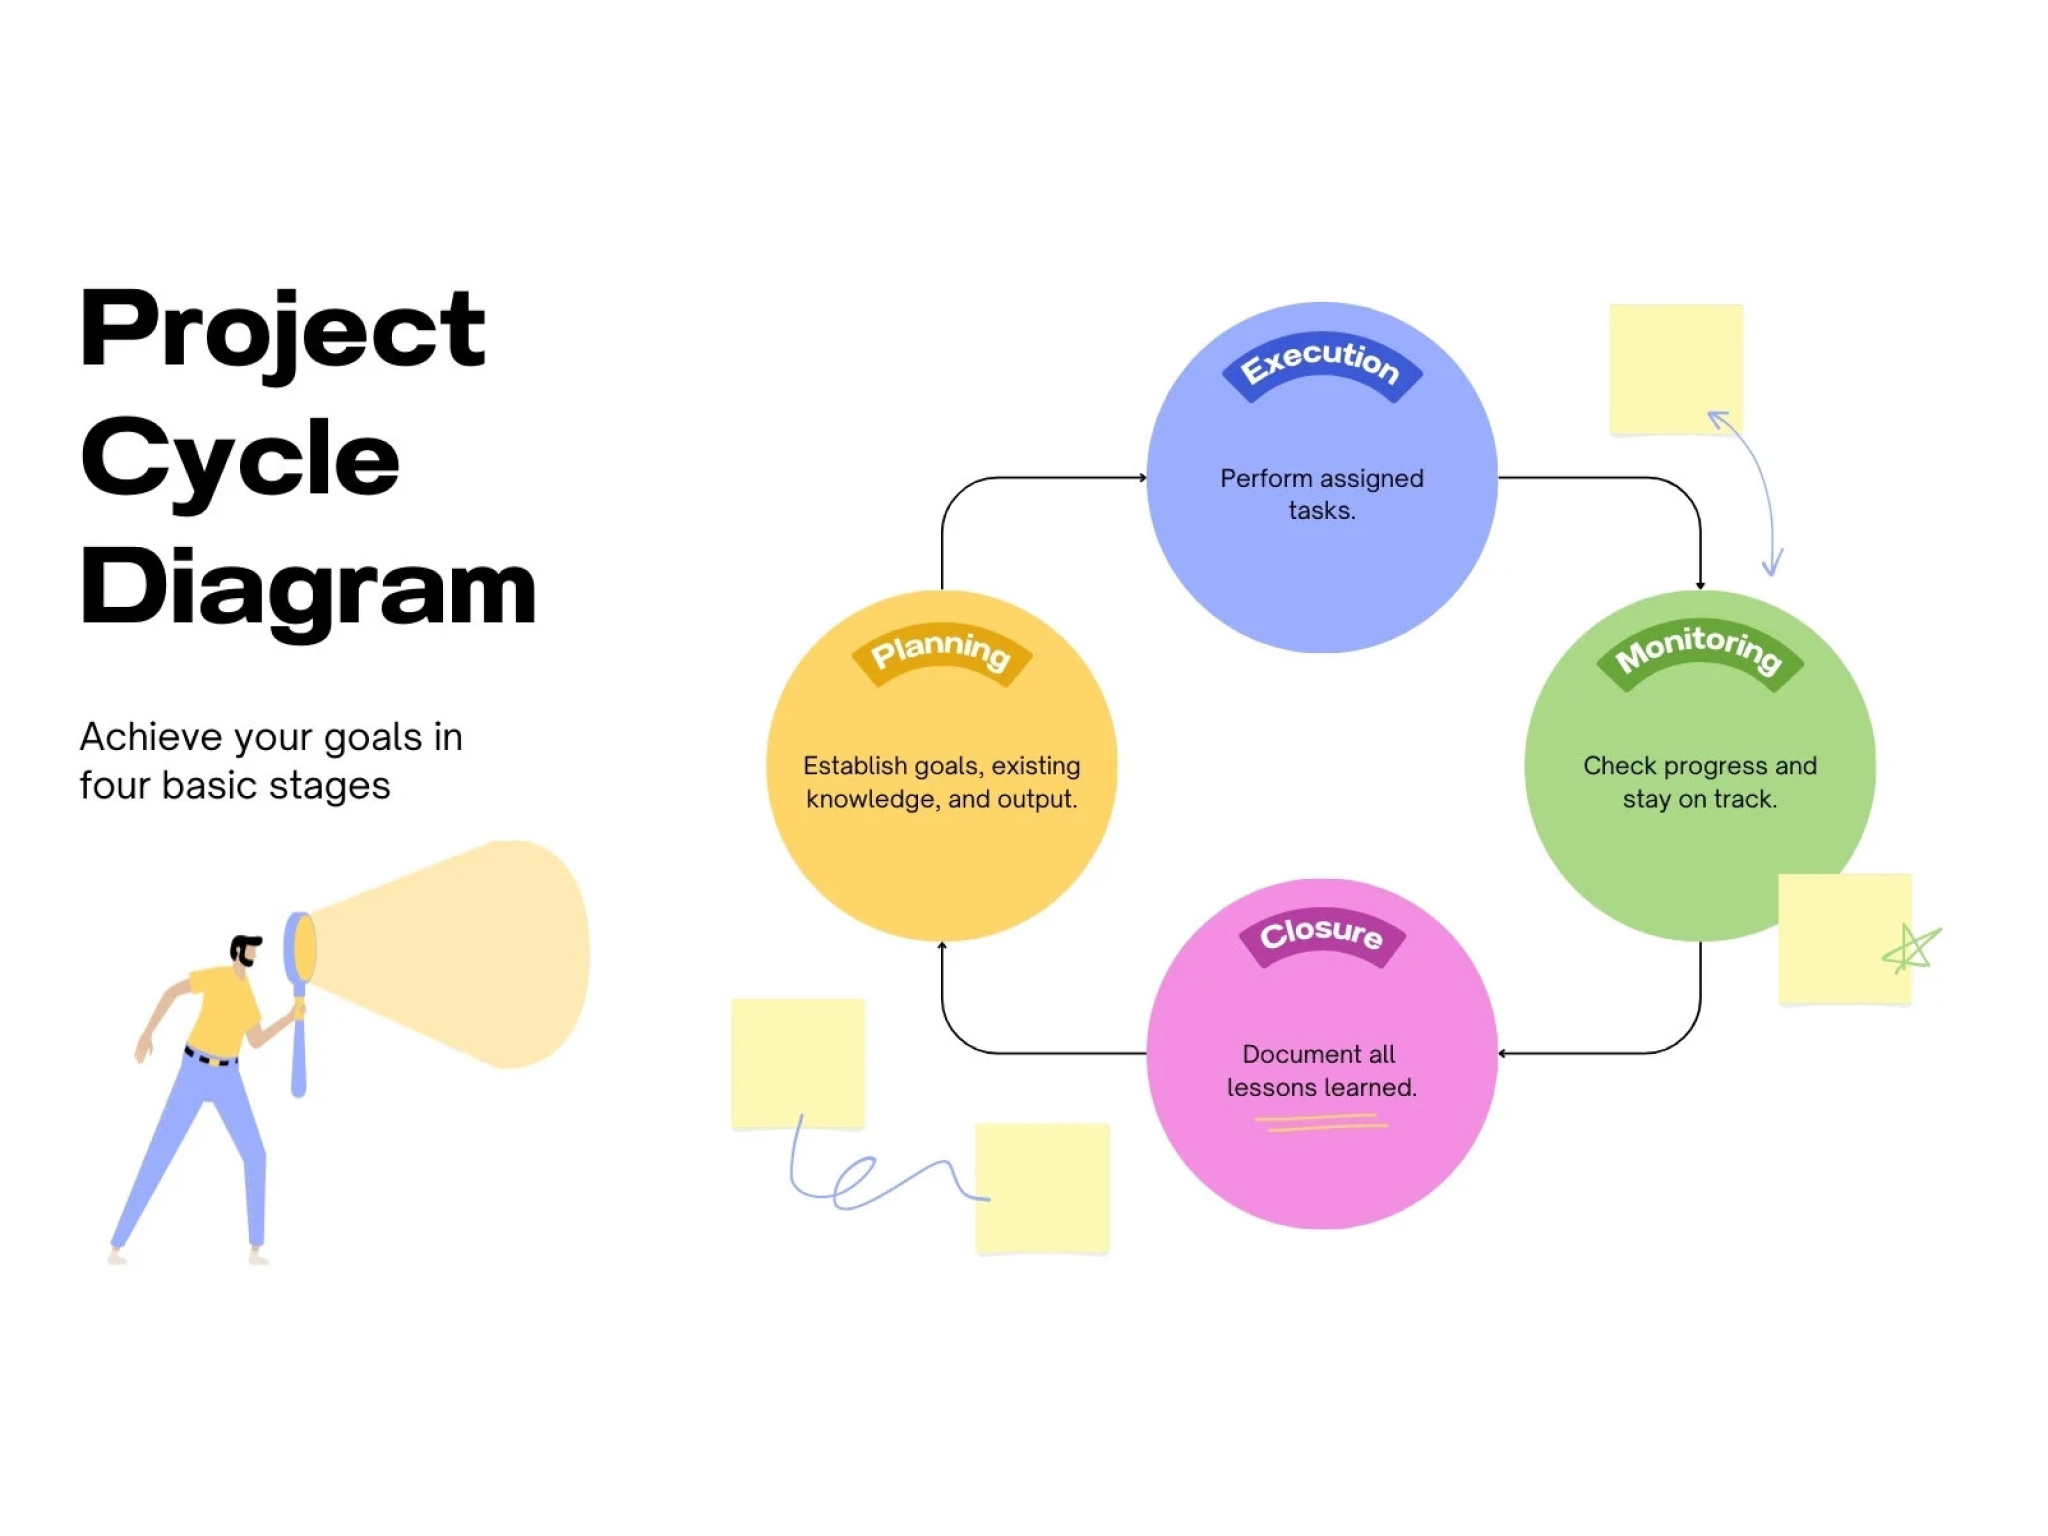
Make your analysis engaging, stunning, and fun. Just choose a Venn diagram design from dozens of stylish templates and switch up the fonts, colors, and shapes to your preference. Add graphics and images from our free library to use as visual cues, or to elevate your diagram further.
Expand your diagram without limits

Don’t hesitate to list down every similarity and difference to exhaust your analysis. With our whiteboard’s unlimited canvas, have all the room you need to keep developing your Venn diagram. Enlarge and duplicate shapes, add more text, embed infographics and presentations, and never run out of space.
Work side by side with your team

Your whiteboard is made for collaboration. Share a link to your Venn diagram and work with your team in real-time. Leave comments, react with stickies, and track brainstorm sessions with our built-in timer. Since your Venn diagram is fully online, your team can come back to it anytime without losing progress.
Start inspired with a Venn diagram template


Assem A
Frequently Asked Questions
- It’s easy to change the colors used in any Canva design. Simply click on the element that you’d like to change, then click the color tile in the toolbar. Select the color you’d like.
You can add text by heading to the Text tab in your whiteboard’s side panel and clicking Add a text box. For a shortcut, just type “T” anywhere on your whiteboard and a text box should automatically appear.
When you edit your text, you can choose from more than 500 fonts. Simply type to add your own message and labels. If you want to change pre-existing text in the template, simply click the text then type.
- Yes! In fact, we have Venn diagram templates designed for this very purpose. Choose a three, four or even five-circle Venn diagram template to get started. As you customize your diagram in your whiteboard, you’re also free to add more circles to your graph.
- Yes! Signing up for Canva is completely free, as well as our templates and design library. To use premium templates, images or illustrations, you can purchase them at an extremely affordable price, or you can subscribe to a Pro subscription. If you don’t want to pay, you can simply remove the premium elements from your design and use our free elements.
- Definitely. Our whiteboard is designed to make teamwork easy. You can add your whole team and control who can edit your design. Together, you can communicate via comments, sticky notes, and sticker reactions, and have brainstorm sessions using our built-in timer – no more back and forth over email!