- Line Graphs
Free Online Line Graph Maker
Supported upload file types: XLSX, CSV, TSV
Track and present your data with a Line Graph and add it to any report or document on Canva for free!
Line Graph maker features
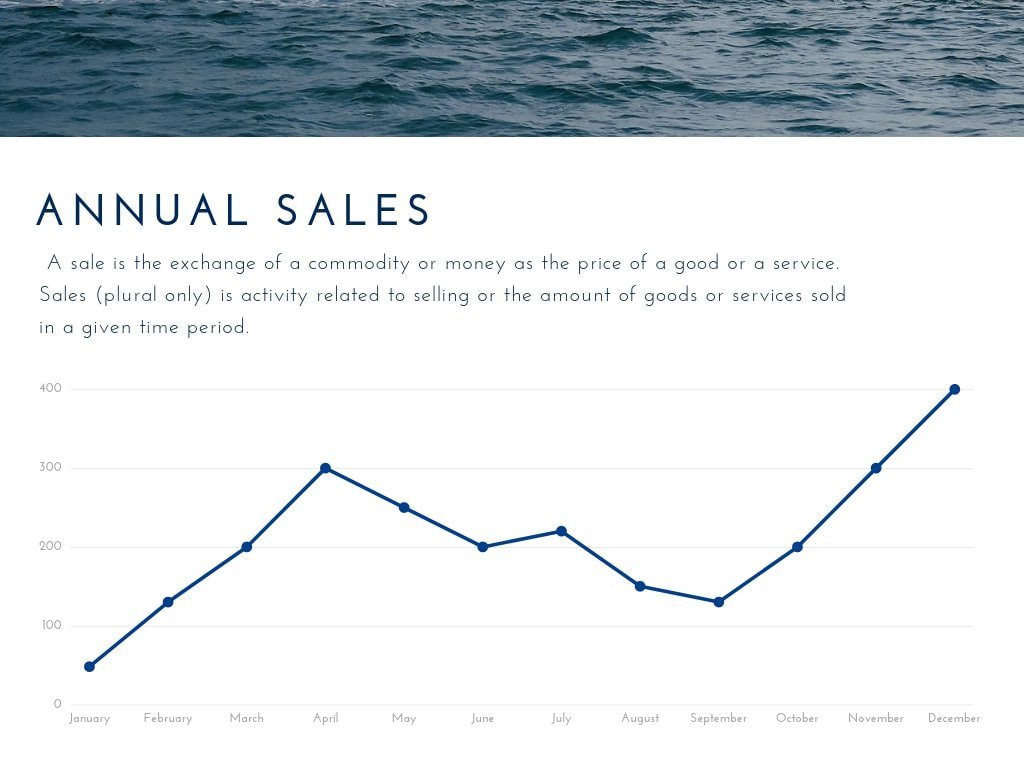
Whether it’s to compare and contrast time, distance or to track changes across a given time period, line graphs are a handy way to present your data visually. Add one to your report easily and quickly with the help of Canva.
More than 20 professional types of graphs to choose from
Professionally designed templates to fast-track your workflow
Data visualization made easy – no complicated software to learn
Publish, share or download your high-resolution line graph
Embed your line graph in presentations, reports and more with no fuss
Easy drag-and-drop tools, made with the non-designer in mind
How to make a line graph

Keep your data in line with Canva’s Line Graph Maker

Fully online and collaborative, Canva lets you create your design with the help of your team or colleagues. Just input your data by manually entering your values and labels or by copying and pasting an existing table straight into the editor. Then sit back and relax as Canva builds your graph for you.
Collaborate with your team

Team projects are easy-peasy in Canva because everything is done online and stored on the cloud. Just share a link to an editable copy of your design with your team and they’ll be able to add their own inputs or edits easily. Because it’s on cloud, they can access it from their own laptops, desktops, iOS and Android devices anytime, anywhere.
Easily add or input data to create your graph

Start building your line graph by clicking on the “Data” button on the toolbar. A table will pop up with some default values. Edit this by manually typing in your numbers and categories or copy and paste an existing table. Plus, clicking on any marker in the line graph will highlight the relevant cell on the table so you can easily identify and edit a given value.
Choose colors, fonts, and add data labels

Personalize your graph to reflect your brand colors or preferences by going to the color palette tool. This is especially helpful when you want to distinguish one line graph from another to easily compare data. You can also use this tool to ensure that your graph matches the color scheme of the rest of your document.
Line graphs templates


Assem A
Frequently Asked Questions
- All of the layouts in our library are free to use as many times as you like. There are also a large range of free images to choose from, otherwise all premium photography, vectors and illustrations in our stock library is all priced at just $1. There are no other fees to use Canva.
- Every design needs balance. Ensuring that your designs are well aligned or well-distributed means that it won’t look cluttered or crowded. Begin by selecting the elements or text you want to align by clicking on it, then click the group button on the toolbar. Once all elements are grouped, click on the arrange button and select whether to align: left, right, center, top, middle, or bottom. To set how you want the elements spaced evenly, click on the Horizontal or Vertical button.
- Create a process flow design that is instantly recognizable by uploading your logo, using your brand color palette and consistent fonts. To upload your logo, click on the Uploads tab, select the Uploads folder, and click on the green Upload your own images button. Select any PNG, JPEG or SVG file you wish to upload from your computer. Uploaded images are automatically saved inside your Uploads folder, ready to be used in other designs.
- Yes! Download our iPhone and iPad apps from the App Store or our Android app from Google Play to design from the office, home or on the go! Otherwise, head to www.canva.com to create designs on the web without downloading or installing anything.