- Scatter Plots
Create a stunning Scatterplot for Free in Canva
Supported upload file types: XLSX, CSV, TSV
Take vast amounts of data and turn them into a clear and comprehensible scatterplot with Canva.
Scatterplot maker features
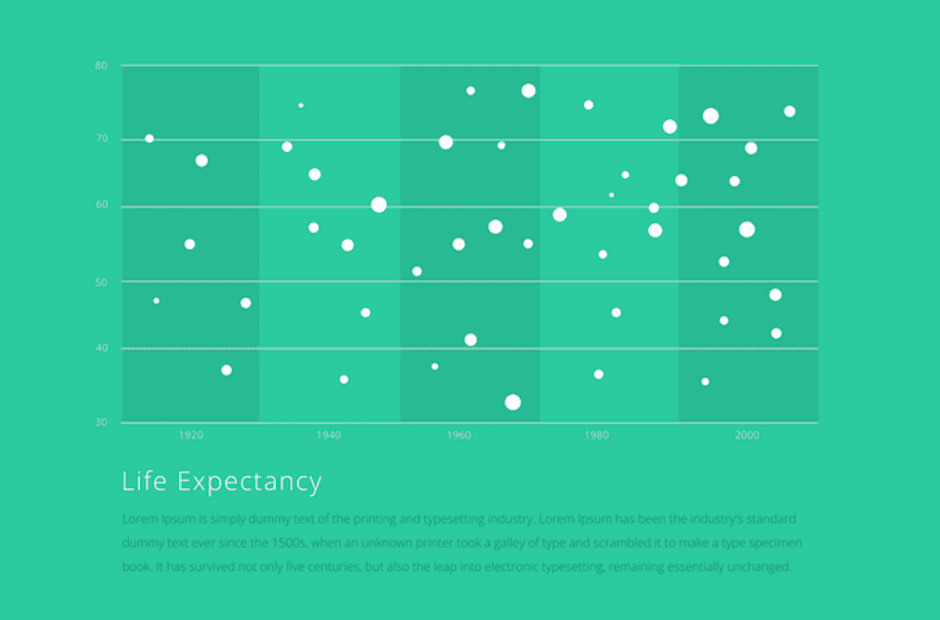
Scatter plots are an awesome tool for presenting a vast and confusing amount of data and turning it into an easy to digest, comprehensible visual aid for your audience or readers. More than any other graph, the scatterplot is best able to display correlation and show how one variable affects the other, allowing you to spot trends and even outliers or those outside the norm.
More than 20 professional types of graphs to choose from
Professionally designed templates to fast-track your workflow
Data visualization made easy – no complicated software to learn
Publish, share or download your high-resolution scatterplot
Embed your scatterplot in presentations, reports and more with no fuss
Easy drag-and-drop tools, made with the non-designer in mind
How to make a scatterplot

Make sense of a large amount of data and turn it into a beautiful graph

Use Canva to create a custom scatterplot and include it any presentation, brochure mockups(opens in a new tab or window), infographic or any other document seamlessly. Start by adding in your labels and values and sit back as Canva builds your graph. Then, customize colors and fonts to perfection!
Change colors, fonts and resize or scale your graph

Make sure individual data sets are properly discernible from each other by color coding each. Why not use your brand’s colors or follow your document theme? It’s as simple as typing in a hex code or selecting the right hue from the color wheel. Make sure your font matches your document theme too by choosing from over a hundred different typefaces in Canva. Finally, you can easily resize or scale your scatterplot by dragging on the corners — easily ensuring that your new graph will fit your presentation slide or document page.
Add or edit data with a few clicks

Canva gives you the option to manually enter your data into a table or copying and pasting from an existing one. Just head over to the table tool on the Canva toolbar and start plotting your x and y axis. If there are any changes down the road, you can always go back and update the table. Plus, if you click on a specific point in your scatterplot, it will automatically highlight the corresponding values in your table so you can quickly identify what needs editing.
Nothing to install, everything is online

With Canva, there’s no need to download or install any software which means you can create or access your designs and charts anytime, anywhere! All you need is an internet connection and any computer or laptop. Need something even handier? You can always design on the go with Canva’s iPhone, iPad and Android app.

Assem A
Frequently Asked Questions
- All of the layouts in our library are free to use as many times as you like. There are also a large range of free images to choose from, otherwise all premium photography, vectors and illustrations in our stock library is all priced at just $1. There are no other fees to use Canva.
- Every design needs balance. Ensuring that your designs are well aligned or well-distributed means that it won’t look cluttered or crowded. Begin by selecting the elements or text you want to align by clicking on it, then click the group button on the toolbar. Once all elements are grouped, click on the arrange button and select whether to align: left, right, center, top, middle, or bottom. To set how you want the elements spaced evenly, click on the Horizontal or Vertical button.
- Create a scatterplot design that is instantly recognizable by uploading your logo, using your brand color palette and consistent fonts. To upload your logo, click on the Uploads tab, select the Uploads folder, and click on the green Upload your own images button. Select any PNG, JPEG or SVG file you wish to upload from your computer. Uploaded images are automatically saved inside your Uploads folder, ready to be used in other designs.
- Yes! Download our iPhone and iPad apps from the App Store or our Android app from Google Play to design from the office, home or on the go! Otherwise, head to www.canva.com to create designs on the web without downloading or installing anything.