- Pie Charts
Free Pie Chart Maker
Supported upload file types: XLSX, CSV, TSV
Show the different parts of a whole with a pie chart made in Canva. Easy to use, completely online and completely free.
Pie chart maker features
With Canva’s pie chart maker, you can make a pie chart in less than a minute. It’s ridiculously easy to use. Start with a template – we’ve got hundreds of pie chart examples to make your own. Then simply click to change the data and the labels. You can get the look you want by adjusting the colors, fonts, background and more.
More than 20 professional types of graphs to choose from
Professionally designed templates to fast-track your workflow
Data visualization made easy – no complicated software to learn
Publish, share or download your high-resolution graph
Embed your pie chart in presentations, reports and more with no fuss
Easy drag-and-drop tools, made with the non-designer in mind
How to make a pie chart

What is a pie chart?
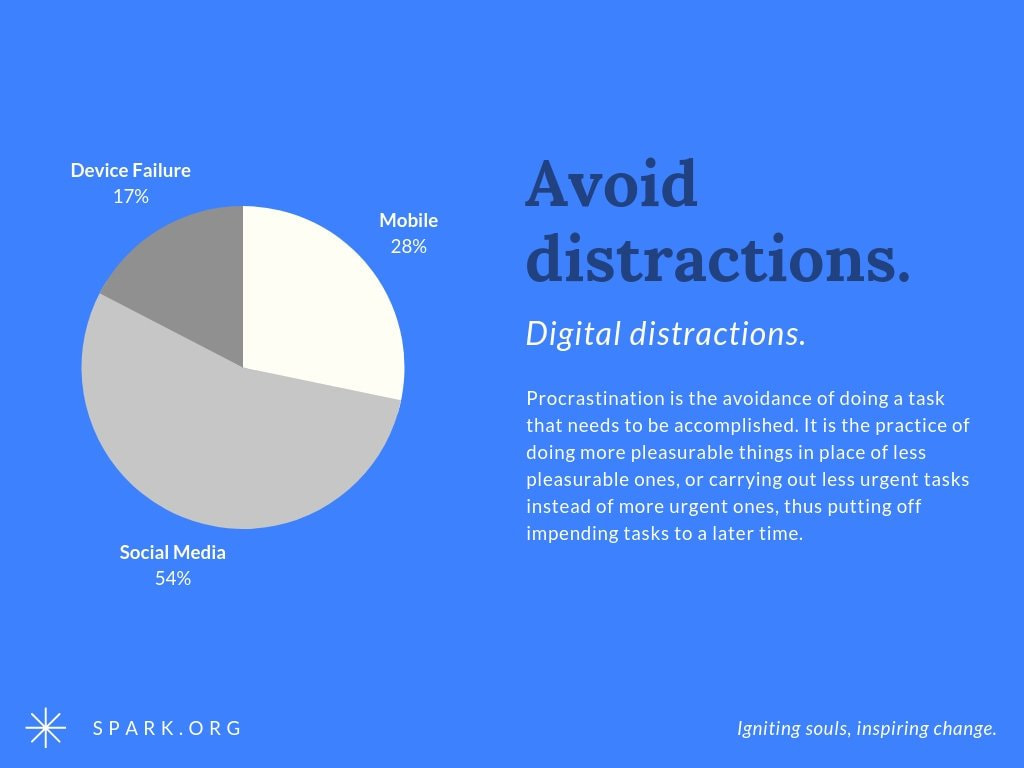
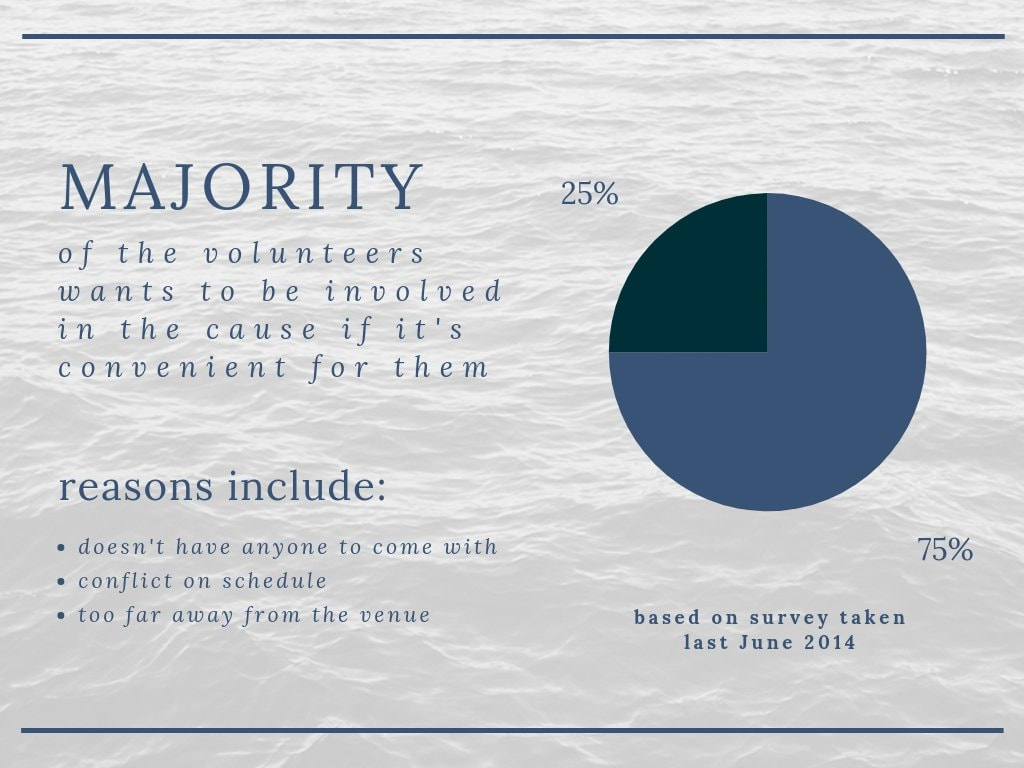
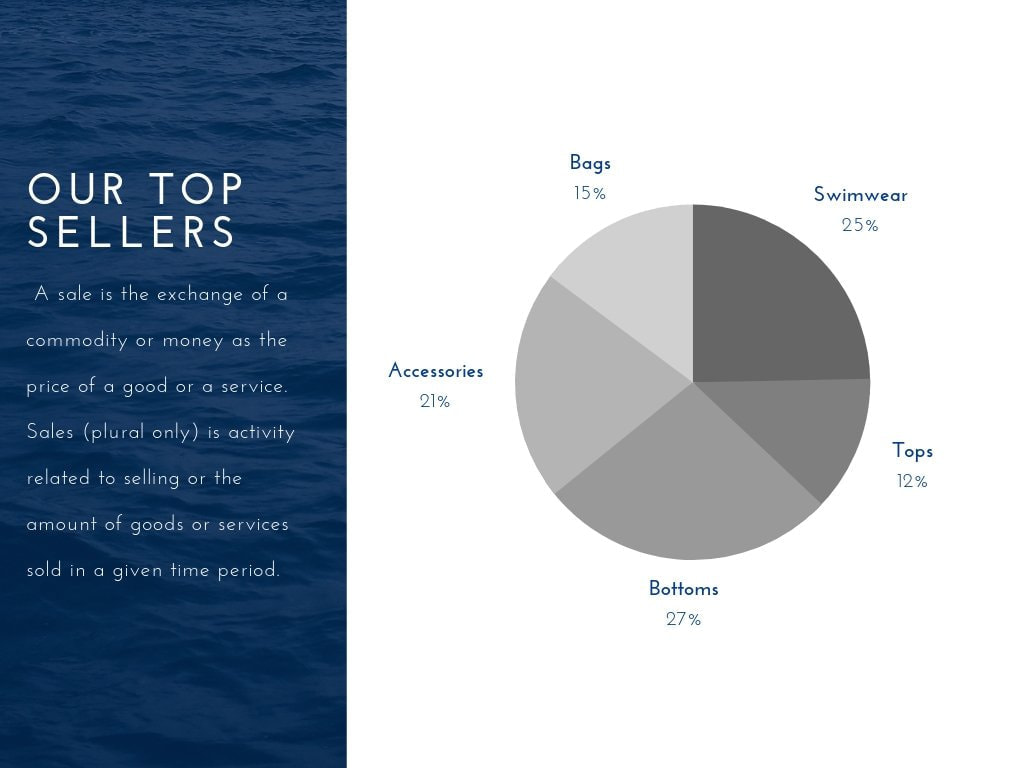
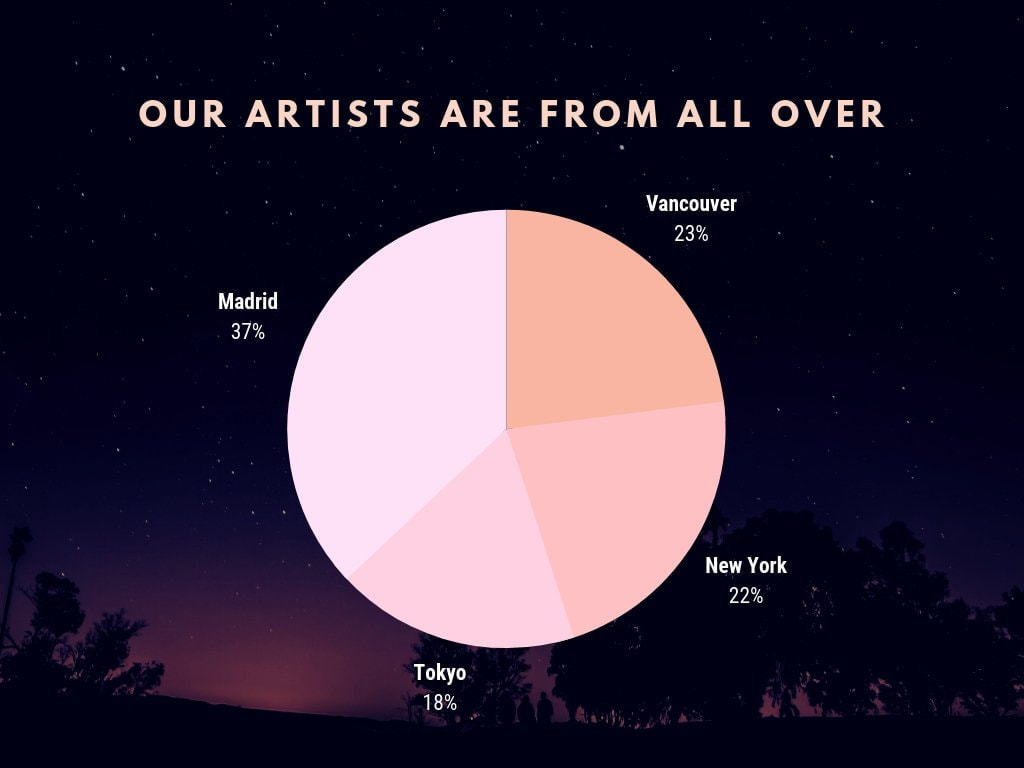
A pie chart, also known as a circle chart, is a circular diagram that resembles a pie. Each of the ‘slices’ represents a category of data that makes up the whole. Together, the pie represents 100 percent. The size of each ‘slice’ is relative to its portion of the whole. Pie charts can become overly complicated if there are too many categories of data being presented. A good pie chart should give information at a glance.
A donut chart or doughnut chart is a kind of pie chart that represents data in a ring rather than a circle. They serve the same function, so you can use them interchangeably depending on what look you prefer.
Add and edit your data in just a few clicks
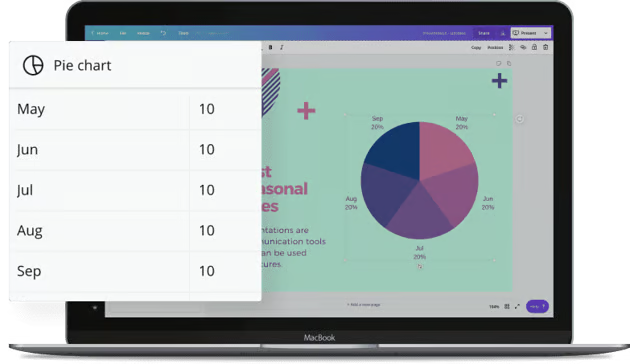
Skip the complicated calculations – with Canva’s pie chart generator, you can turn raw data into a finished pie chart in minutes. A simple click will open the data section where you can add values. You can even copy and paste the data from a spreadsheet. Click the text to edit the labels.
Bring your whole team on board

Canva is made with teams in mind. Invite your team and control who can change what by giving View and Edit access. No more going back and forth over email to make minor adjustments – with Canva, your whole team can work on the same graph. Your graph is stored in the cloud, so you can access it wherever you have internet connection.
Adjust the colors to get the look you want
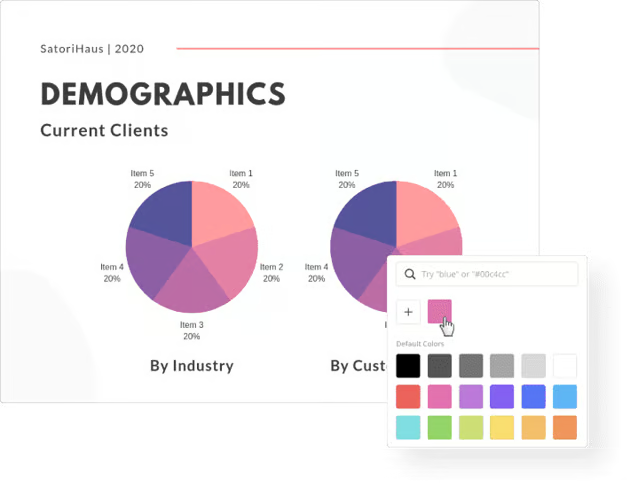
Make your pie chart a work of art. In Canva, you can easily add a designer-made color palette to your pie chart. It’s a great way to make your chart stand out – making your information eye-catching and easy to understand at a glance, too. You can also scale or resize your pie chart to the size you need.
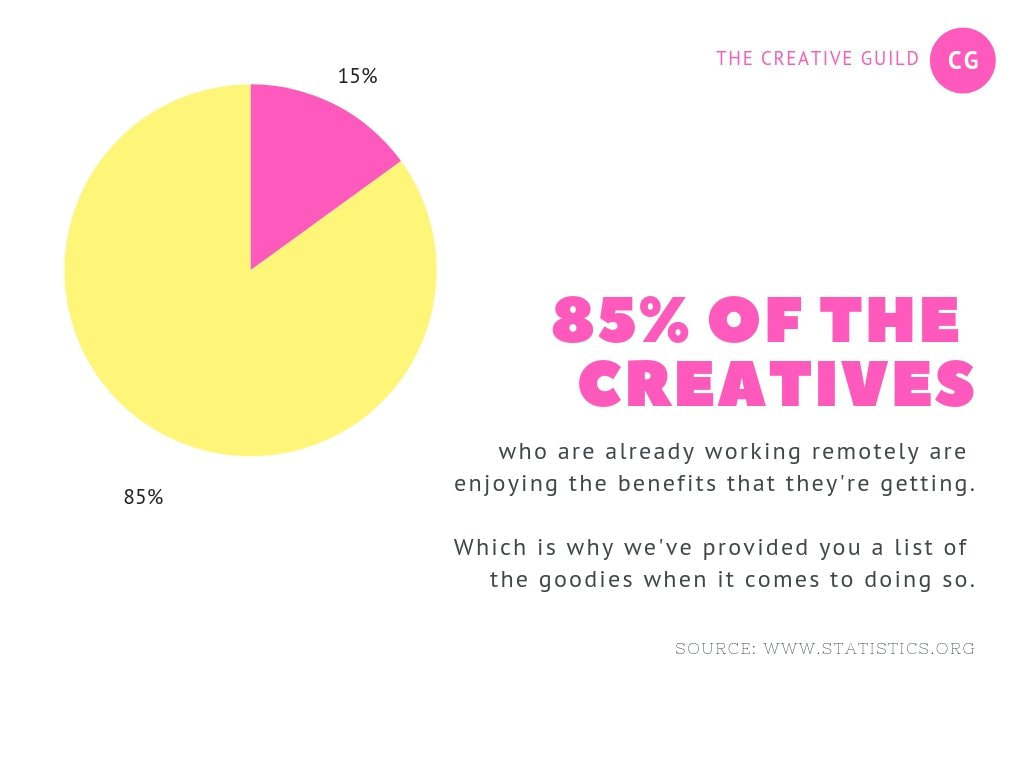
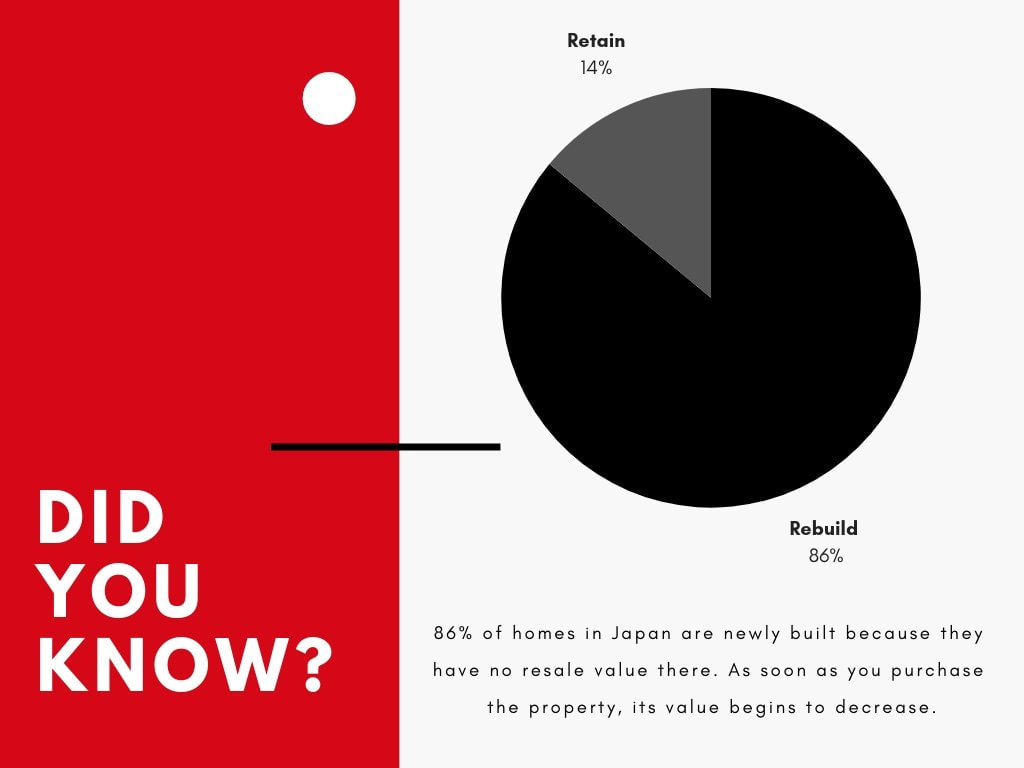
Embed your pie chart in presentations, reports, and more

Canva’s pie charts can be embedded in all kinds of graphics and documents. We’ve got tens of thousands of templates to choose from, so you can keep a consistent, stylish look. Simply choose what you’d like to make – whether it’s a presentation, an infographic or something else – then select a template. Add your pie chart from the side panel in Canva’s editor.
When you’re all done, you can download your pie chart as a JPEG, PNG or PDF file, share it on your social media, or email it directly to someone.
Pie chart templates


Assem A
Frequently Asked Questions
- Yes! Signing up for Canva is completely free, and it’s free to use. Most of Canva‘s pre-designed templates and images are free as well. Canva’s premium templates, images or illustrations and purchase come at an extremely affordable price. If you don‘t want to pay, you can simply remove the premium elements from your design.
- Yes. Canva is designed to make teamwork easy. You can add you whole team, and control who can edit your design. You can also add comments – no more back and forth over email!
- To create a pie chart with your data in Excel or Google Sheets, simply open a Canva pie chart, then copy and paste the data from your spreadsheet. Our pie chart generator will make a chart based on this data.