- Block Diagrams

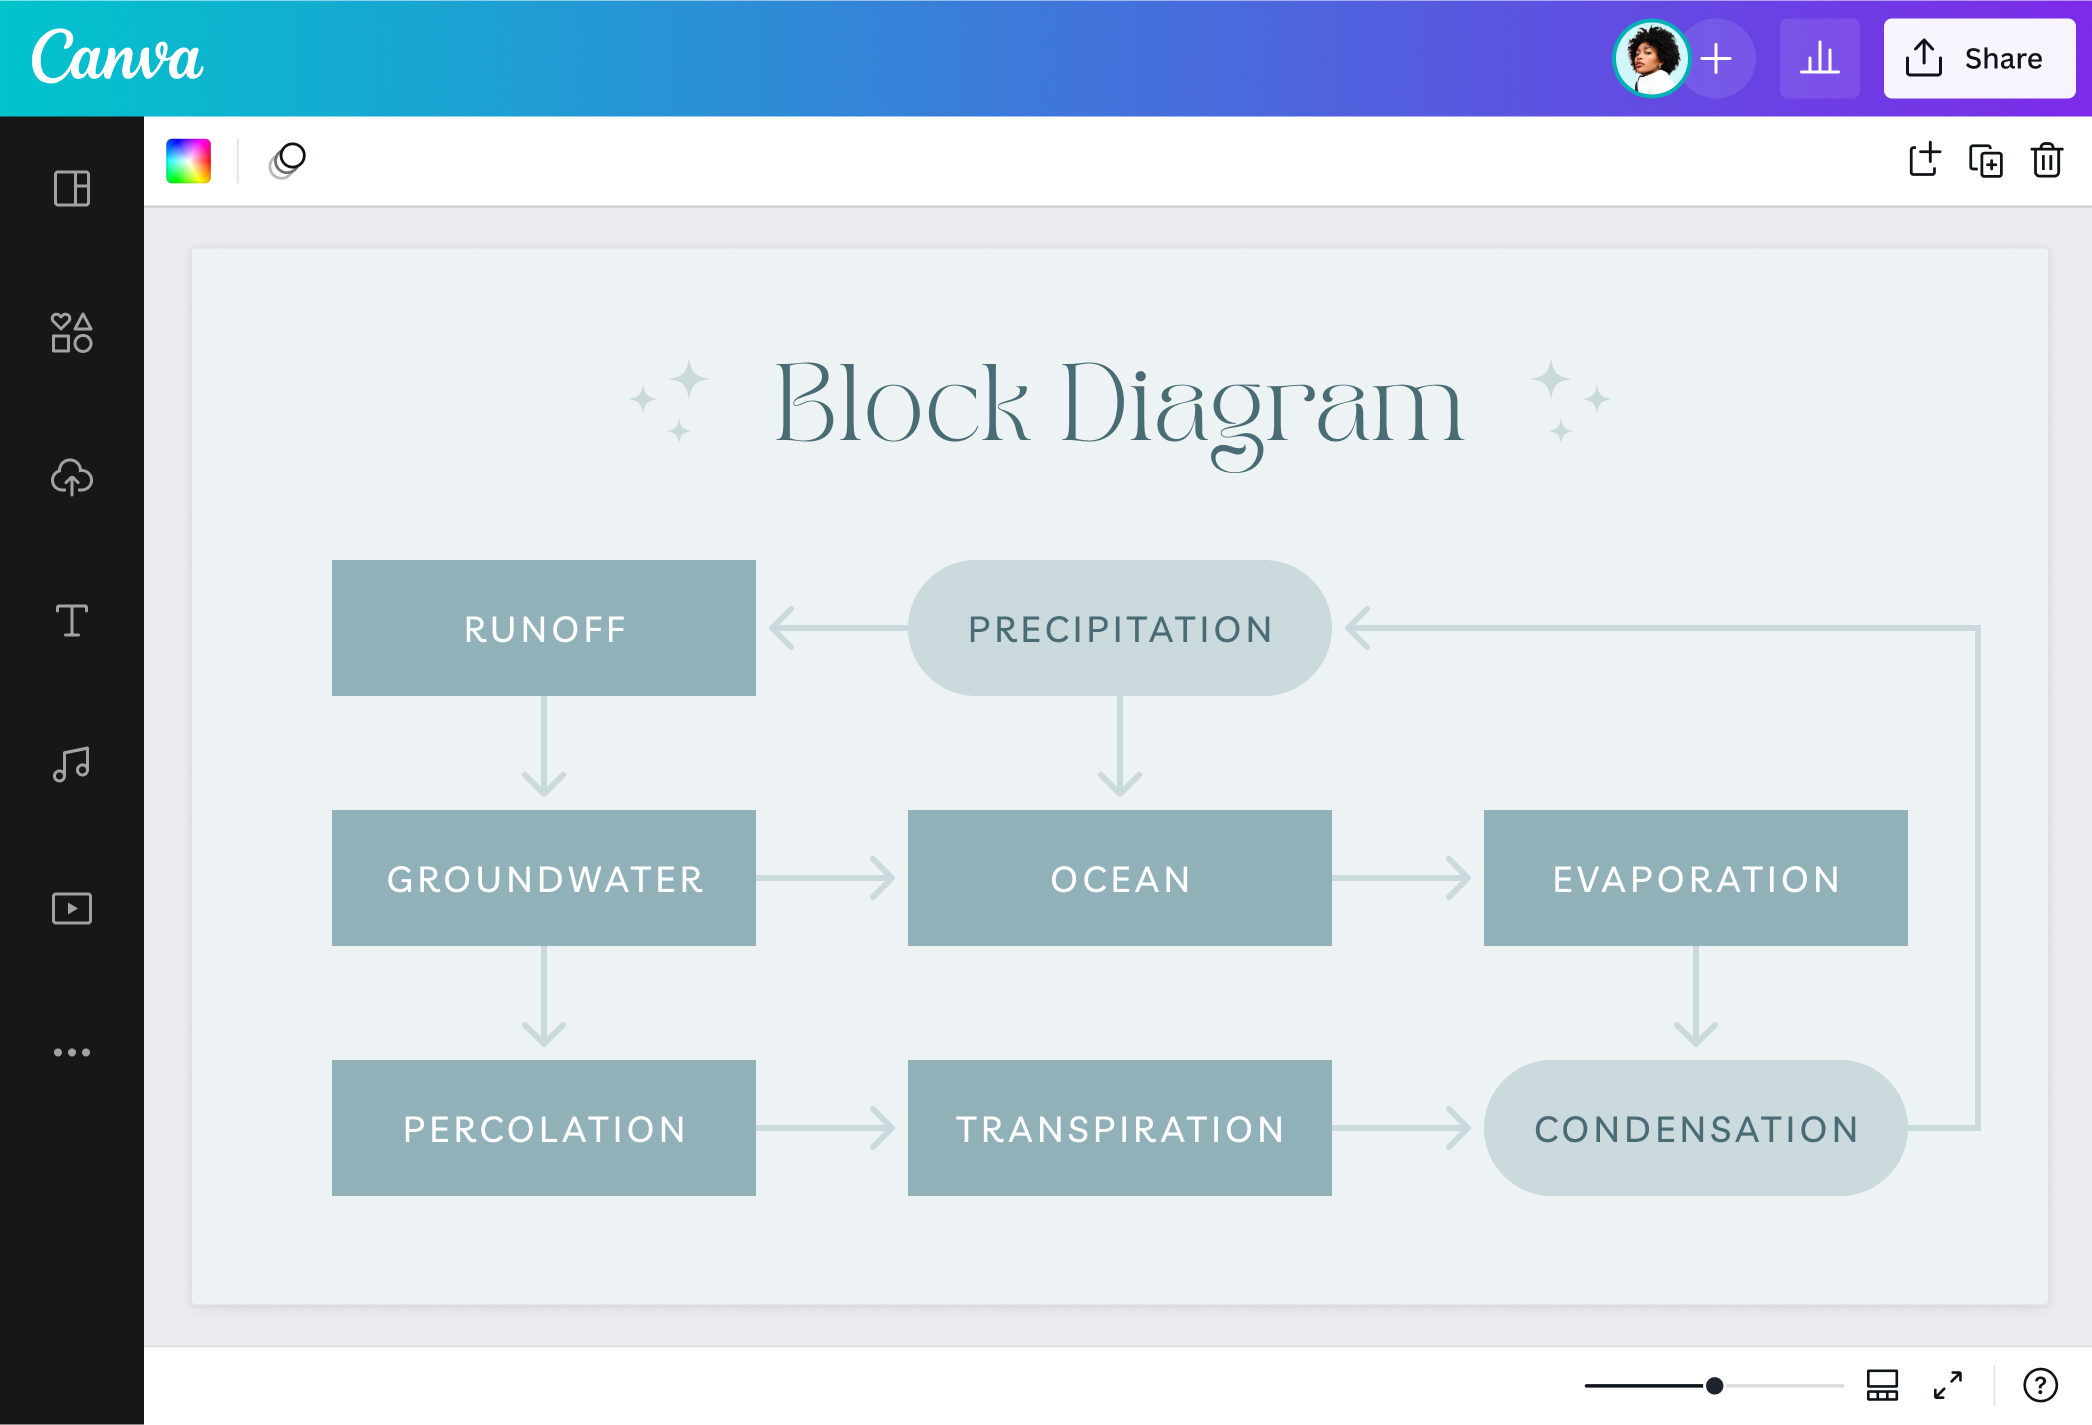
Free Online Block Diagram Maker
Block diagram maker features
Visualize high-level processes and systems using our free online block diagram maker. Powered by an intuitive design editor, drag-and-drop formatting tools, and convenient sharing and collaboration features, designing a block diagram for any purpose is a breeze.
More than 20 professional types of graphs to choose from
Professionally designed templates to fast-track your workflow
Data visualization made easy – no complicated software to learn
Publish, share or download your high-resolution graph
Embed your block diagram in presentations, whiteboards, reports, and more with no fuss
Easy drag-and-drop tools, made with the non-designer in mind
How to make a block diagram

What is a Block Diagram?
A block diagram is a simplified visual representation of a complex system or process using interconnected blocks, arrows, and lines. It is mostly used in engineering, hardware, and software tools. Block diagrams simplify workflows, organize processes, or showcase relationships between different systems, making them a useful addition to an SRS document(opens in a new tab or window).
Block diagrams for easy data visualization and organization

Easily organize and visualize processes and systems with Canva’s block diagram creator. Drag and drop blocks, text, arrows, lines, and other graphic elements into your diagram design. Expand your design into a whiteboard and get an unlimited canvas for electric diagrams, functional block diagrams, or detailed system visualizations. The possibilities are endless with Canva's intuitive design editing tools at your fingertips.
Effortless designing with our vast shape and graphics library

With our block diagram maker, you can freely use any shape, line, arrow, and other graphic elements from our diverse library to visualize and simplify high-level processes and systems. Everything is fully customizable—from text, blocks, connectors, symbols, and colors—to give you total control whether you’re ideating on new hardware design or recommending process improvements.
Easy real-time collaboration and sharing

Explaining complex systems and process flows into easy-to-understand chunks is easier with our block diagram maker’s real-time collaboration feature. Leave comments for your teammates to review, add to-do stickies for a classmate to work on, or communicate with a stakeholder by directly tagging them on your block diagram design. Plus, you can easily share your block diagrams as PNG, PDF, or JPEG files or publish a link to your work on social media, email, or website.
Block diagram templates


Kelsey J
Frequently Asked Questions
- Block diagrams visualize complex workflows, organize processes, or showcase relationships between different systems in a simplified, high-level illustration. Various industries use block diagrams in different ways. For example, electrical engineers use block diagrams to make electrical schematics, while software or mechanical engineers use them to ideate or improve software or hardware design.
Flow charts are simple diagrams that visually showcase the steps in completing a task or the sequence of how an algorithm is implemented. Often flow charts have an end or a solution to a task. They also use a set of symbols to denote different parts of a process, e.g., rectangular boxes for a step, a diamond shape for a decision, or an oblong shape for the start and end of a task/process.
On the other hand, block diagrams visualize entire processes, complex current/ideal systems, or the arrangement of different components of a device or machine. They are intended as a simple, high-level overview of complex systems, so non-technical stakeholders can more easily understand systems and interactions. Often, they only use rectangular blocks, connector lines, and arrows to showcase the relationship between each block.
- Block diagrams and schematic diagrams are both graphical representations of complex systems or processes using interconnected blocks, lines, and arrows. The main difference between a block diagram and a schematic diagram lies in the amount of information they hold. Block diagrams often showcase high-level systems and information, emphasizing how the entire system works. In contrast, schematic diagrams offer more detailed information about how each process, device, or component works.