- Process Flow

Process Flow
Create a process flow diagram online
Break down complex processes into smaller steps with efficient process flows. Create a process flow diagram on Canva Whiteboards and use it to visualize the big picture and your role within it. With a host of creative elements and design tools, you have everything you need to take control of your workflow.
Infinite space made for unlimited ideas
Professionally designed templates to fast-track your workflow
Share and ideate with anyone, anytime, on any device
Run a workshop with whiteboard elements, sticky notes, and a timer
Embed your process flow in Docs, presentations, and more easily
Easy online whiteboard tools and data visualization
How to create a process flow

What is a process flow?
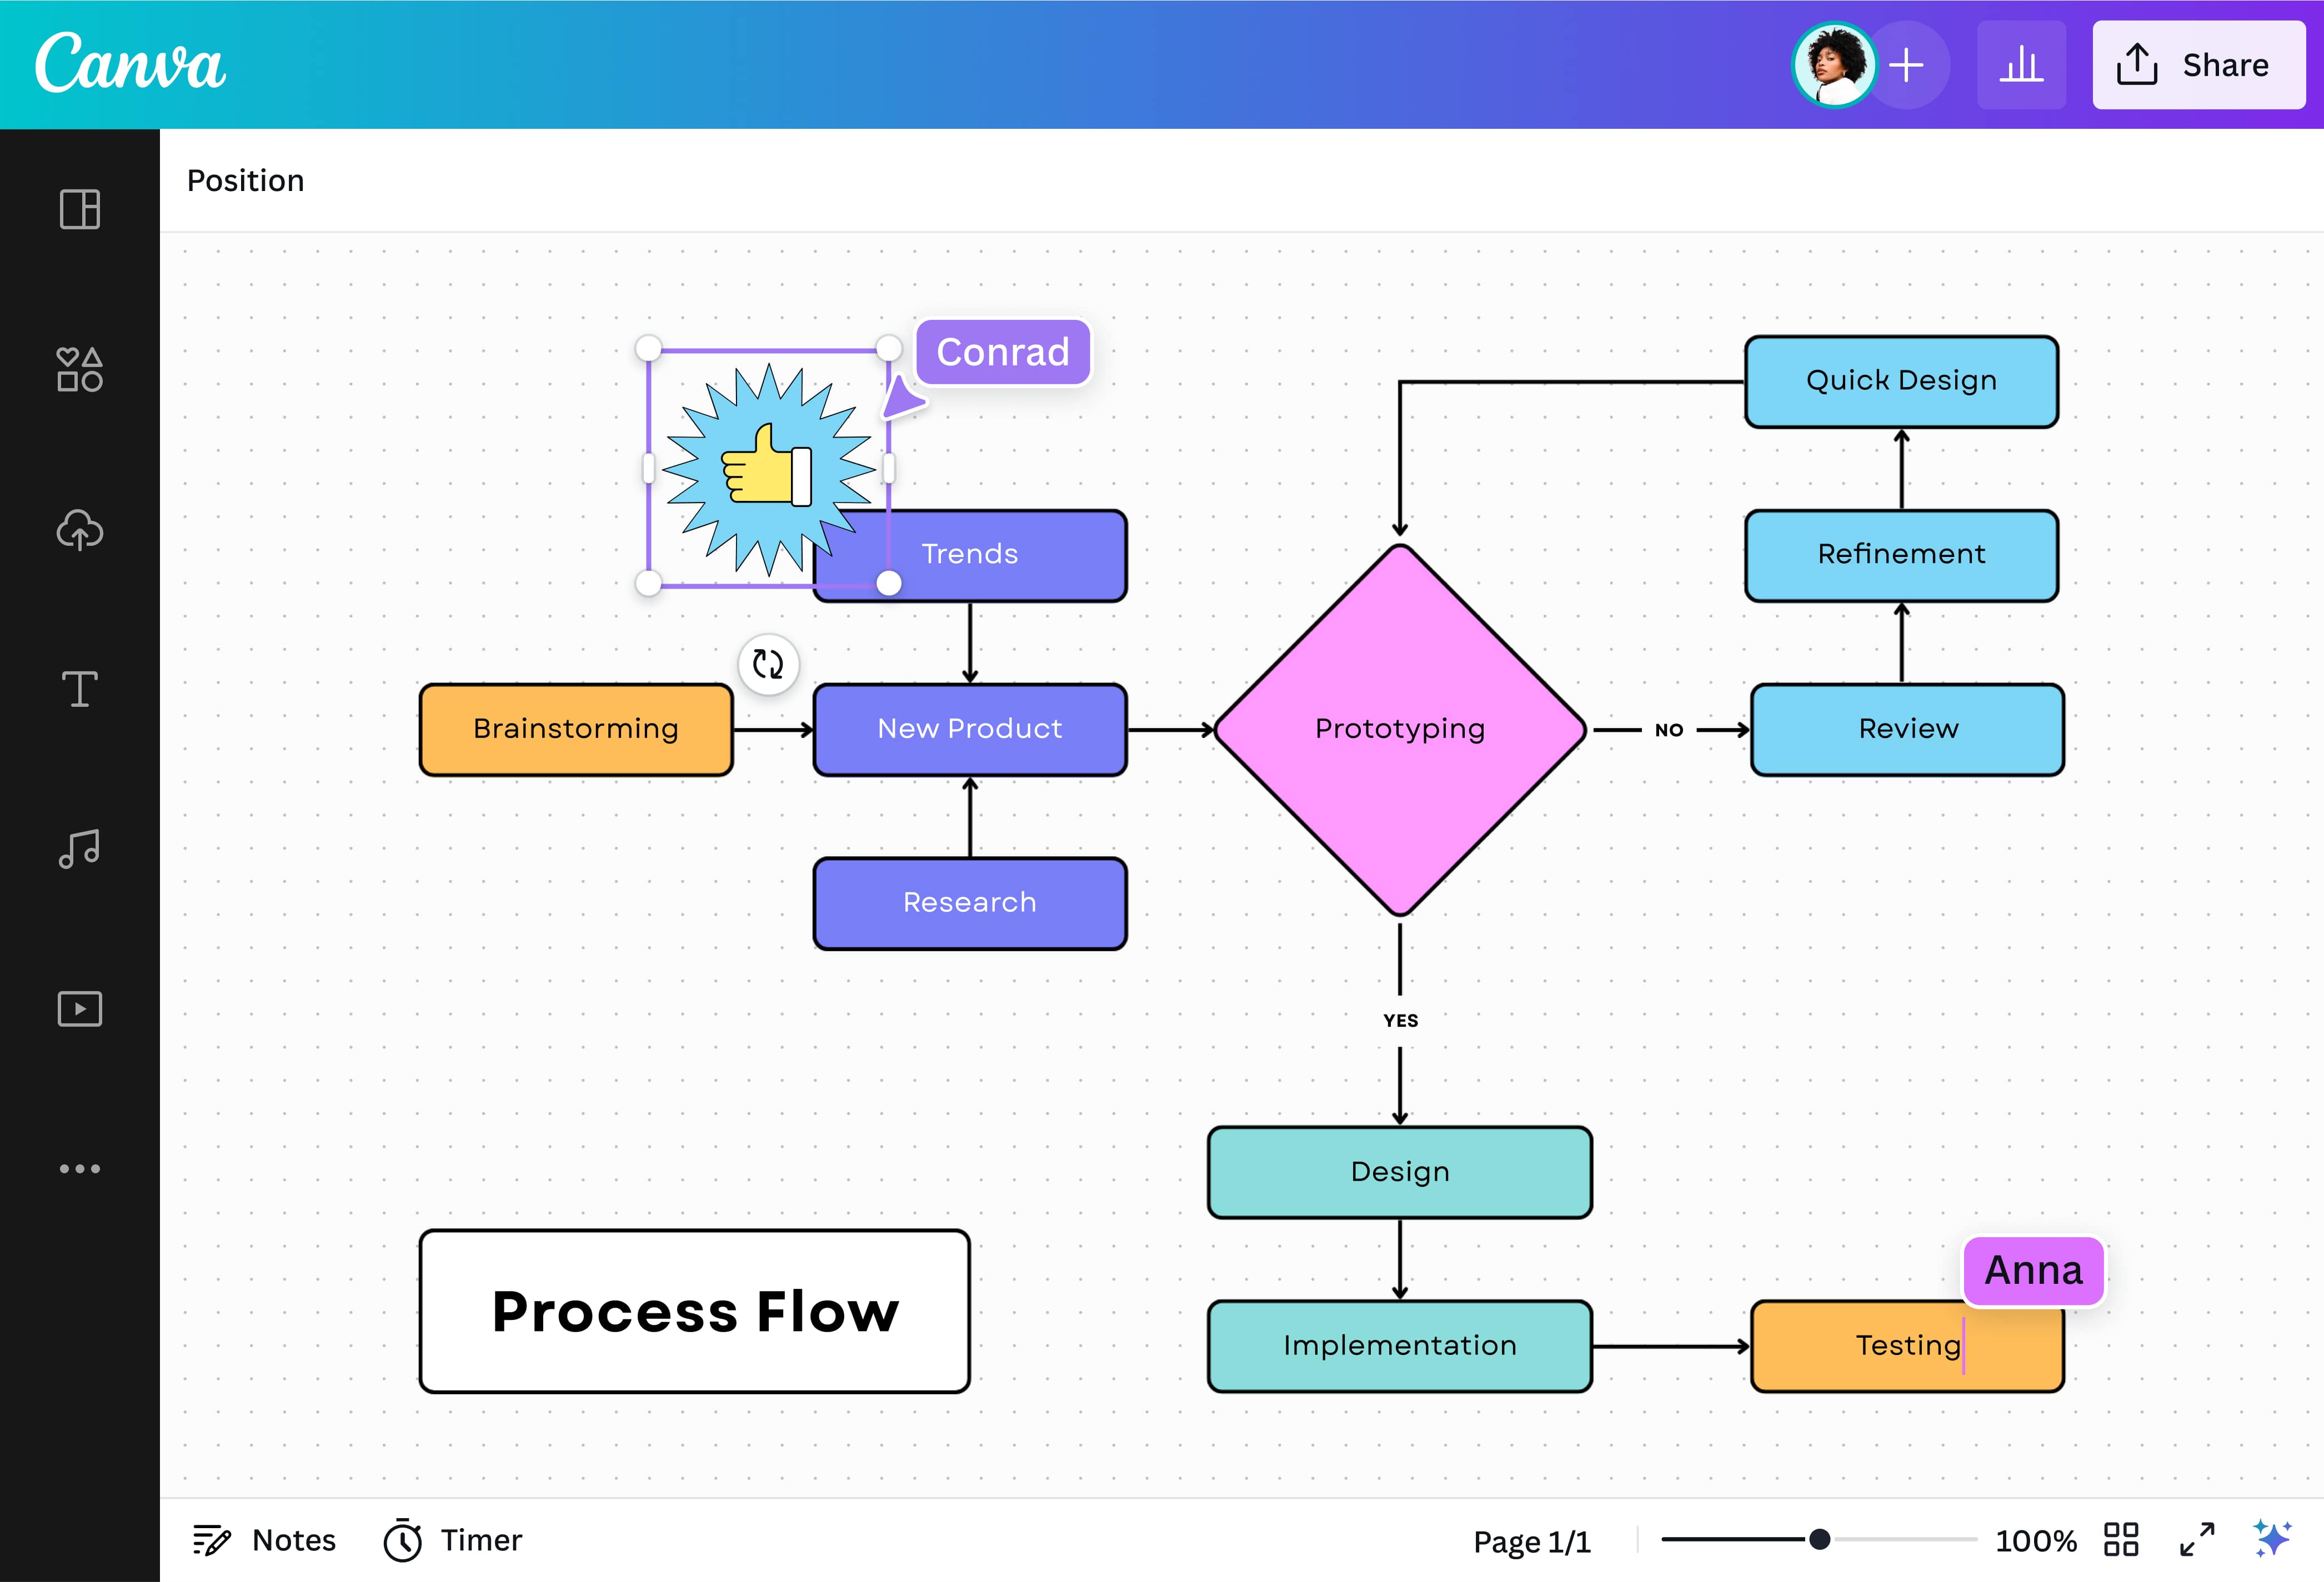
A process flow is a visual representation of the steps and actions within a specific workflow or business process. Often created as process flow charts or diagrams, they use symbols, shapes, and arrows to illustrate the logical flow of tasks and the relationships between them. A process flow chart is an effective tool for teams, project managers, and stakeholders to document and communicate a process and ensure everyone involved understands their roles and responsibilities.
Why use process flows?

Process flows present an overview of various interrelated tasks and activities within a process. It maps out these activities in a structured and easy-to-understand format, making it easy to spot bottlenecks and areas for improvement.
Craft a process flow for any project—whether drafting a marketing campaign, improving logistics operations, or documenting employee onboarding plans. With a well-designed business process flow, you can gain clarity and enhance collaboration across teams, ensuring things are on track to hit your goals. In software development, this often works alongside an SRS document(opens in a new tab or window) to capture detailed requirements.
Dive deep into your workflow

Go in-depth and map out every step, task, and activity in your workflow with an online process flow diagram. Start inspired with free templates from Canva Whiteboards, add shapes and icons to represent each step, and then connect parts to show relationships between tasks. For more structured project planning, consider using a PERT chart(opens in a new tab or window)to outline timelines and dependencies clearly. Go beyond simple text and arrows—use our whiteboard elements to craft a stunning, easy-to-read diagram of your process flow.
Chart your course to success

Develop a logical flow in your process chart by making the most of our imaginative tools. Sketch your flowchart with Draw(opens in a new tab or window) and use Shape Assist to perfect your rectangles, arrows, and diamonds. Then, use Text to Image(opens in a new tab or window) to generate custom icons or Magic Write(opens in a new tab or window) to summarize wordy text. Understand the flow of your process and use our online whiteboard tool to capture every detail in a visual chart.
Make waves with stylish elements

Create a splash with your process flow with a library of design elements at your fingertips. Find plenty of shapes and symbols to represent the steps, decisions, and flow of your process chart. Use grids to evenly space elements or group related process steps or decision points. You can also pick out easy-to-read fonts and harmonious color combinations that match your branding or preferred style.
Let your ideas set sail

Grow your ideas with Canva Whiteboards, where you have infinite space to collaborate with your team and refine the flow of your process diagram. Run a brainstorming session and stay on topic with a timer. React or flesh out ideas through stickies and voting graphics. Effortlessly draw your process flow in a diagram, then present it to stakeholders or edit it on the go whenever inspiration strikes. You can also boost your team's productivity with a detailed Standard Operating Procedure(opens in a new tab or window) (SOP) to streamline workflows and ensure consistent execution of tasks.

Assem A
Frequently Asked Questions
- To document a process flow, start by identifying the specific process you want to chart or diagram and break it down into a series of steps. Make a visual representation of these steps through a flowchart. Use different shapes and symbols to depict process steps, decision points, and connectors, then label each element properly. Lastly, review your process flow chart with your team to ensure clarity and accuracy and make necessary changes.
- A parallelogram is often used to represent resources in a process flow diagram. This symbol indicates the inputs or outputs of a process, like data entered in documents and forms. A parallelogram helps mark the stages or steps where a resource enters or leaves the process.
- Multiple arrows in a process flow chart represent different paths or directions. This generally occurs after a decision point, which illustrates there may be alternative paths or scenarios depending on a specific condition or choice made at that point. Each arrow represents a possible path or outcome that the process can follow.